Black/African American vs German Russian Single Mother Poverty
COMPARE
Black/African American
German Russian
Single Mother Poverty
Single Mother Poverty Comparison
Blacks/African Americans
German Russians
35.2%
SINGLE MOTHER POVERTY
0.0/ 100
METRIC RATING
322nd/ 347
METRIC RANK
31.3%
SINGLE MOTHER POVERTY
0.2/ 100
METRIC RATING
265th/ 347
METRIC RANK
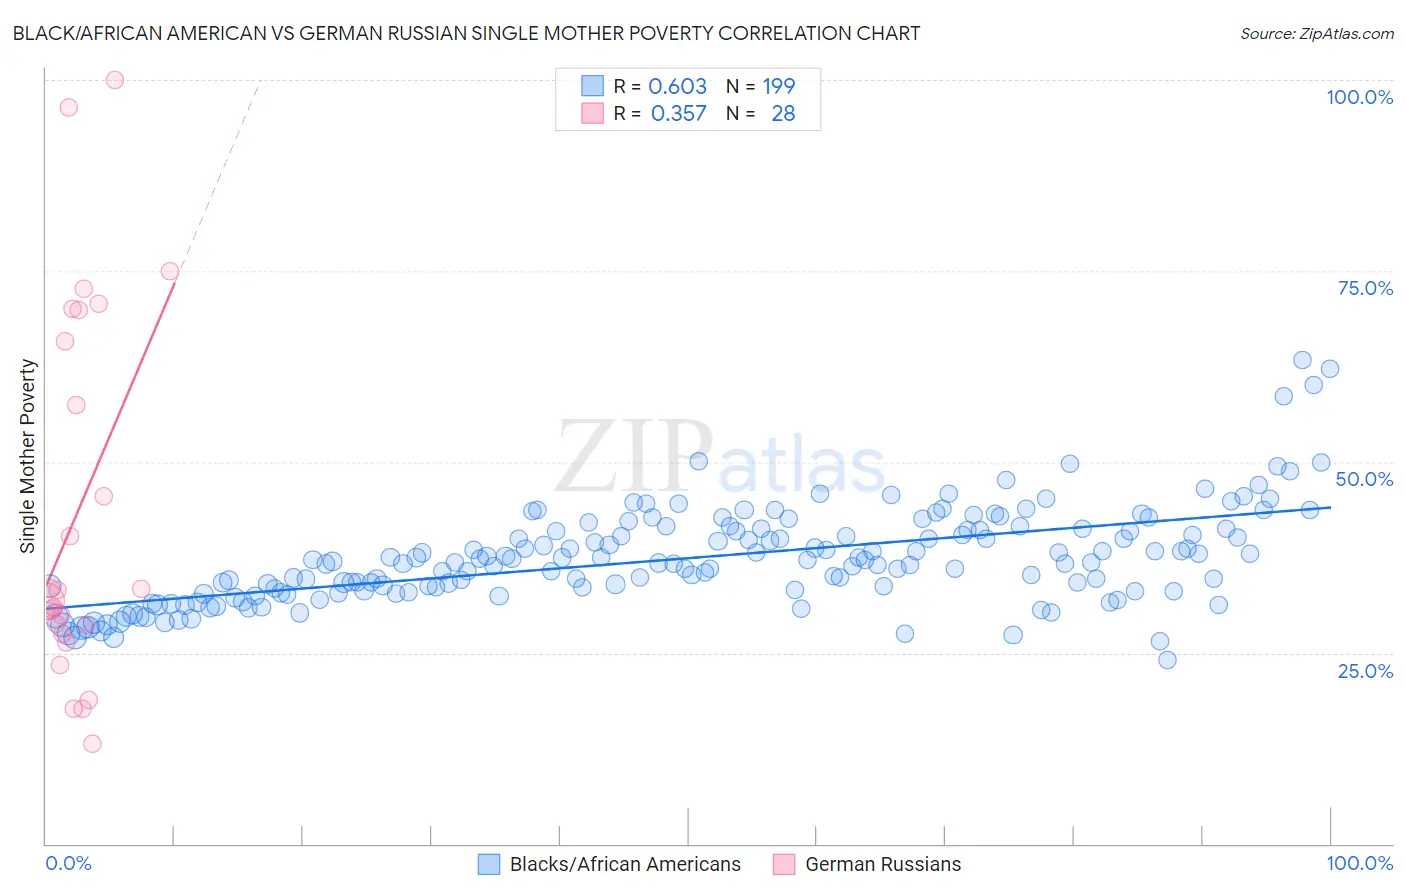
Black/African American vs German Russian Single Mother Poverty Correlation Chart
The statistical analysis conducted on geographies consisting of 541,579,434 people shows a significant positive correlation between the proportion of Blacks/African Americans and poverty level among single mothers in the United States with a correlation coefficient (R) of 0.603 and weighted average of 35.2%. Similarly, the statistical analysis conducted on geographies consisting of 95,920,640 people shows a mild positive correlation between the proportion of German Russians and poverty level among single mothers in the United States with a correlation coefficient (R) of 0.357 and weighted average of 31.3%, a difference of 12.4%.
Single Mother Poverty Correlation Summary
| Measurement | Black/African American | German Russian |
| Minimum | 24.1% | 13.1% |
| Maximum | 63.3% | 100.0% |
| Range | 39.2% | 86.9% |
| Mean | 37.4% | 43.6% |
| Median | 36.8% | 32.5% |
| Interquartile 25% (IQ1) | 33.1% | 28.1% |
| Interquartile 75% (IQ3) | 41.1% | 67.9% |
| Interquartile Range (IQR) | 8.0% | 39.8% |
| Standard Deviation (Sample) | 6.3% | 24.4% |
| Standard Deviation (Population) | 6.3% | 24.0% |
Similar Demographics by Single Mother Poverty
Demographics Similar to Blacks/African Americans by Single Mother Poverty
In terms of single mother poverty, the demographic groups most similar to Blacks/African Americans are Paiute (35.1%, a difference of 0.20%), Kiowa (35.5%, a difference of 0.71%), Ottawa (35.5%, a difference of 0.92%), Iroquois (34.8%, a difference of 1.1%), and Chippewa (34.8%, a difference of 1.3%).
| Demographics | Rating | Rank | Single Mother Poverty |
| Hopi | 0.0 /100 | #315 | Tragic 34.5% |
| Dominicans | 0.0 /100 | #316 | Tragic 34.5% |
| Cherokee | 0.0 /100 | #317 | Tragic 34.5% |
| Immigrants | Honduras | 0.0 /100 | #318 | Tragic 34.7% |
| Chippewa | 0.0 /100 | #319 | Tragic 34.8% |
| Iroquois | 0.0 /100 | #320 | Tragic 34.8% |
| Paiute | 0.0 /100 | #321 | Tragic 35.1% |
| Blacks/African Americans | 0.0 /100 | #322 | Tragic 35.2% |
| Kiowa | 0.0 /100 | #323 | Tragic 35.5% |
| Ottawa | 0.0 /100 | #324 | Tragic 35.5% |
| Ute | 0.0 /100 | #325 | Tragic 35.7% |
| Seminole | 0.0 /100 | #326 | Tragic 35.8% |
| Yakama | 0.0 /100 | #327 | Tragic 36.4% |
| Choctaw | 0.0 /100 | #328 | Tragic 36.4% |
| Apache | 0.0 /100 | #329 | Tragic 36.6% |
Demographics Similar to German Russians by Single Mother Poverty
In terms of single mother poverty, the demographic groups most similar to German Russians are Immigrants from Ecuador (31.3%, a difference of 0.030%), Bahamian (31.3%, a difference of 0.040%), Subsaharan African (31.4%, a difference of 0.070%), Immigrants from Belize (31.4%, a difference of 0.22%), and Hmong (31.2%, a difference of 0.31%).
| Demographics | Rating | Rank | Single Mother Poverty |
| Immigrants | Caribbean | 0.4 /100 | #258 | Tragic 31.1% |
| Immigrants | Bangladesh | 0.4 /100 | #259 | Tragic 31.1% |
| Whites/Caucasians | 0.3 /100 | #260 | Tragic 31.2% |
| Immigrants | El Salvador | 0.3 /100 | #261 | Tragic 31.2% |
| Hmong | 0.3 /100 | #262 | Tragic 31.2% |
| Bahamians | 0.2 /100 | #263 | Tragic 31.3% |
| Immigrants | Ecuador | 0.2 /100 | #264 | Tragic 31.3% |
| German Russians | 0.2 /100 | #265 | Tragic 31.3% |
| Sub-Saharan Africans | 0.2 /100 | #266 | Tragic 31.4% |
| Immigrants | Belize | 0.2 /100 | #267 | Tragic 31.4% |
| Immigrants | Senegal | 0.1 /100 | #268 | Tragic 31.5% |
| Scotch-Irish | 0.1 /100 | #269 | Tragic 31.5% |
| British West Indians | 0.1 /100 | #270 | Tragic 31.5% |
| Immigrants | Cabo Verde | 0.1 /100 | #271 | Tragic 31.6% |
| Immigrants | Micronesia | 0.1 /100 | #272 | Tragic 31.6% |