Belgian vs Yakama Seniors Poverty Over the Age of 65
COMPARE
Belgian
Yakama
Seniors Poverty Over the Age of 65
Seniors Poverty Over the Age of 65 Comparison
Belgians
Yakama
9.5%
SENIORS POVERTY OVER THE AGE OF 65
99.7/ 100
METRIC RATING
38th/ 347
METRIC RANK
14.8%
SENIORS POVERTY OVER THE AGE OF 65
0.0/ 100
METRIC RATING
323rd/ 347
METRIC RANK
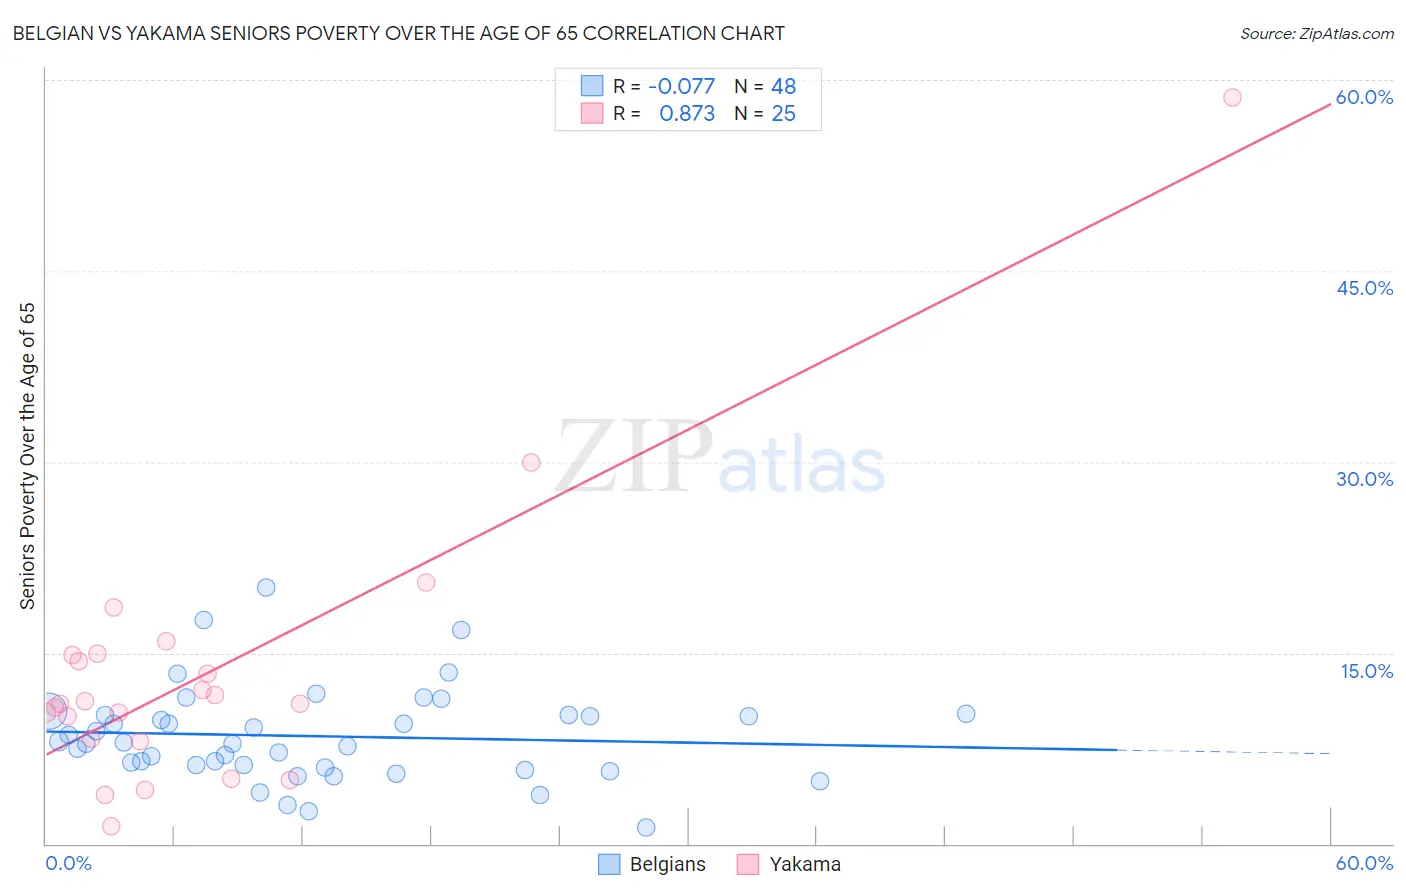
Belgian vs Yakama Seniors Poverty Over the Age of 65 Correlation Chart
The statistical analysis conducted on geographies consisting of 354,885,444 people shows a slight negative correlation between the proportion of Belgians and poverty level among seniors over the age of 65 in the United States with a correlation coefficient (R) of -0.077 and weighted average of 9.5%. Similarly, the statistical analysis conducted on geographies consisting of 19,876,988 people shows a very strong positive correlation between the proportion of Yakama and poverty level among seniors over the age of 65 in the United States with a correlation coefficient (R) of 0.873 and weighted average of 14.8%, a difference of 55.6%.
Seniors Poverty Over the Age of 65 Correlation Summary
| Measurement | Belgian | Yakama |
| Minimum | 1.3% | 1.4% |
| Maximum | 20.1% | 58.6% |
| Range | 18.8% | 57.2% |
| Mean | 8.4% | 13.4% |
| Median | 7.9% | 11.0% |
| Interquartile 25% (IQ1) | 6.1% | 8.2% |
| Interquartile 75% (IQ3) | 10.1% | 14.9% |
| Interquartile Range (IQR) | 4.0% | 6.7% |
| Standard Deviation (Sample) | 3.7% | 11.1% |
| Standard Deviation (Population) | 3.7% | 10.9% |
Similar Demographics by Seniors Poverty Over the Age of 65
Demographics Similar to Belgians by Seniors Poverty Over the Age of 65
In terms of seniors poverty over the age of 65, the demographic groups most similar to Belgians are Scotch-Irish (9.5%, a difference of 0.020%), Czechoslovakian (9.5%, a difference of 0.52%), Latvian (9.5%, a difference of 0.57%), Greek (9.6%, a difference of 0.63%), and Assyrian/Chaldean/Syriac (9.6%, a difference of 0.76%).
| Demographics | Rating | Rank | Seniors Poverty Over the Age of 65 |
| Finns | 99.8 /100 | #31 | Exceptional 9.4% |
| Northern Europeans | 99.8 /100 | #32 | Exceptional 9.4% |
| Native Hawaiians | 99.8 /100 | #33 | Exceptional 9.4% |
| British | 99.8 /100 | #34 | Exceptional 9.4% |
| Latvians | 99.8 /100 | #35 | Exceptional 9.5% |
| Czechoslovakians | 99.8 /100 | #36 | Exceptional 9.5% |
| Scotch-Irish | 99.7 /100 | #37 | Exceptional 9.5% |
| Belgians | 99.7 /100 | #38 | Exceptional 9.5% |
| Greeks | 99.6 /100 | #39 | Exceptional 9.6% |
| Assyrians/Chaldeans/Syriacs | 99.6 /100 | #40 | Exceptional 9.6% |
| Immigrants | North Macedonia | 99.6 /100 | #41 | Exceptional 9.6% |
| Zimbabweans | 99.6 /100 | #42 | Exceptional 9.6% |
| Eastern Europeans | 99.6 /100 | #43 | Exceptional 9.6% |
| Austrians | 99.5 /100 | #44 | Exceptional 9.6% |
| Estonians | 99.5 /100 | #45 | Exceptional 9.6% |
Demographics Similar to Yakama by Seniors Poverty Over the Age of 65
In terms of seniors poverty over the age of 65, the demographic groups most similar to Yakama are Immigrants from Barbados (14.8%, a difference of 0.15%), Houma (14.7%, a difference of 0.54%), Immigrants from Haiti (14.7%, a difference of 0.75%), Cape Verdean (14.7%, a difference of 0.93%), and Nicaraguan (15.0%, a difference of 1.4%).
| Demographics | Rating | Rank | Seniors Poverty Over the Age of 65 |
| Immigrants | Guyana | 0.0 /100 | #316 | Tragic 14.5% |
| Haitians | 0.0 /100 | #317 | Tragic 14.5% |
| Immigrants | Honduras | 0.0 /100 | #318 | Tragic 14.5% |
| Cape Verdeans | 0.0 /100 | #319 | Tragic 14.7% |
| Immigrants | Haiti | 0.0 /100 | #320 | Tragic 14.7% |
| Houma | 0.0 /100 | #321 | Tragic 14.7% |
| Immigrants | Barbados | 0.0 /100 | #322 | Tragic 14.8% |
| Yakama | 0.0 /100 | #323 | Tragic 14.8% |
| Nicaraguans | 0.0 /100 | #324 | Tragic 15.0% |
| Central American Indians | 0.0 /100 | #325 | Tragic 15.1% |
| Immigrants | Armenia | 0.0 /100 | #326 | Tragic 15.2% |
| Crow | 0.0 /100 | #327 | Tragic 15.2% |
| Sioux | 0.0 /100 | #328 | Tragic 15.3% |
| Immigrants | Dominica | 0.0 /100 | #329 | Tragic 15.5% |
| Immigrants | St. Vincent and the Grenadines | 0.0 /100 | #330 | Tragic 15.5% |