Asian vs Hawaiian Child Poverty Under the Age of 16
COMPARE
Asian
Hawaiian
Child Poverty Under the Age of 16
Child Poverty Under the Age of 16 Comparison
Asians
Hawaiians
13.5%
CHILD POVERTY UNDER THE AGE OF 16
99.6/ 100
METRIC RATING
33rd/ 347
METRIC RANK
16.4%
CHILD POVERTY UNDER THE AGE OF 16
38.2/ 100
METRIC RATING
182nd/ 347
METRIC RANK
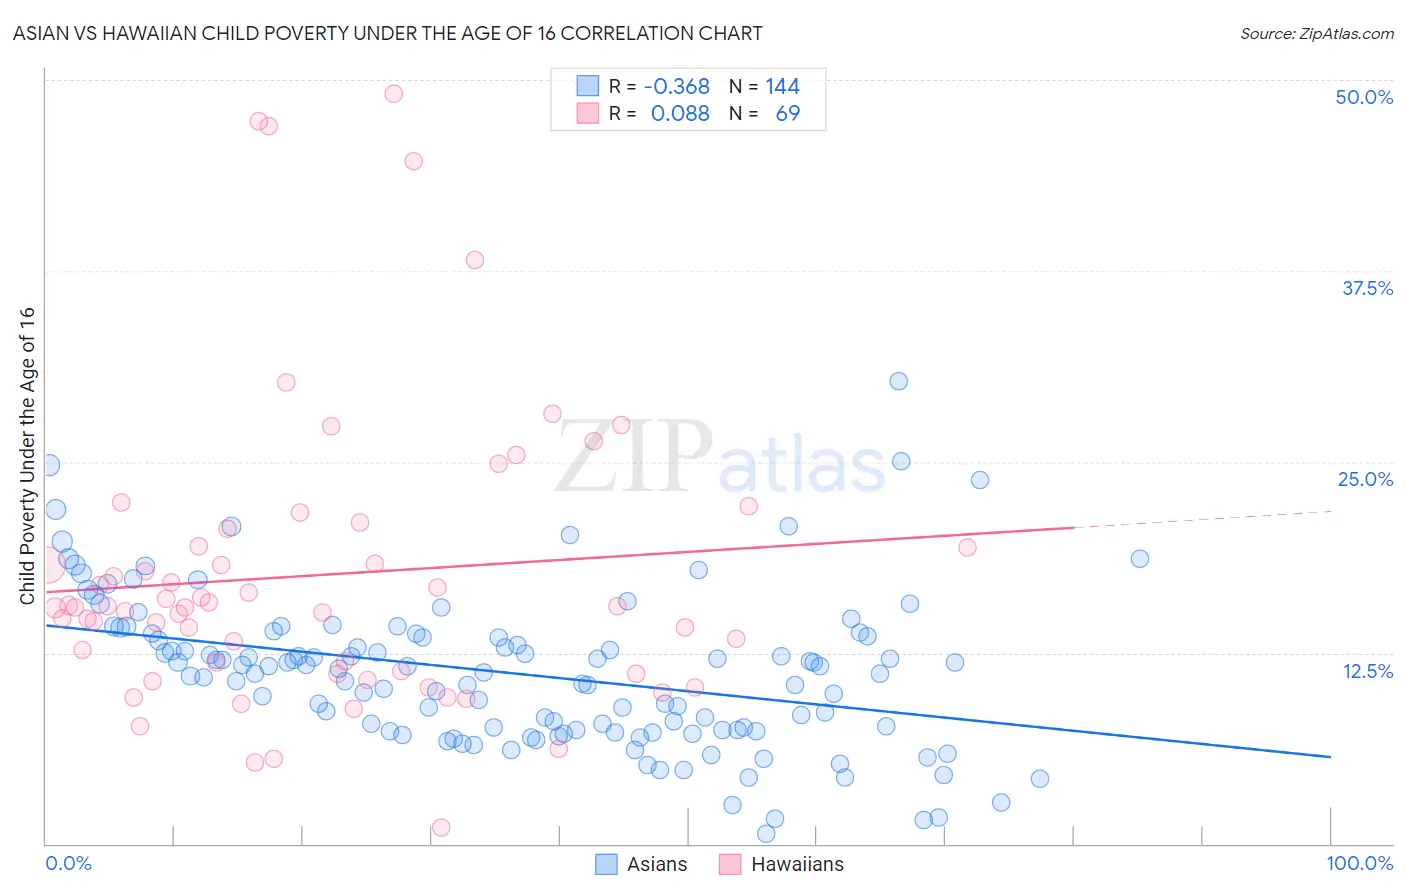
Asian vs Hawaiian Child Poverty Under the Age of 16 Correlation Chart
The statistical analysis conducted on geographies consisting of 540,573,654 people shows a mild negative correlation between the proportion of Asians and poverty level among children under the age of 16 in the United States with a correlation coefficient (R) of -0.368 and weighted average of 13.5%. Similarly, the statistical analysis conducted on geographies consisting of 325,733,413 people shows a slight positive correlation between the proportion of Hawaiians and poverty level among children under the age of 16 in the United States with a correlation coefficient (R) of 0.088 and weighted average of 16.4%, a difference of 22.1%.
Child Poverty Under the Age of 16 Correlation Summary
| Measurement | Asian | Hawaiian |
| Minimum | 0.65% | 1.1% |
| Maximum | 30.3% | 49.1% |
| Range | 29.6% | 48.0% |
| Mean | 11.2% | 17.6% |
| Median | 11.3% | 15.5% |
| Interquartile 25% (IQ1) | 7.4% | 11.2% |
| Interquartile 75% (IQ3) | 13.7% | 20.1% |
| Interquartile Range (IQR) | 6.2% | 8.8% |
| Standard Deviation (Sample) | 5.0% | 9.7% |
| Standard Deviation (Population) | 5.0% | 9.6% |
Similar Demographics by Child Poverty Under the Age of 16
Demographics Similar to Asians by Child Poverty Under the Age of 16
In terms of child poverty under the age of 16, the demographic groups most similar to Asians are Russian (13.5%, a difference of 0.28%), Lithuanian (13.5%, a difference of 0.48%), Tongan (13.4%, a difference of 0.49%), Danish (13.4%, a difference of 0.50%), and Turkish (13.4%, a difference of 0.71%).
| Demographics | Rating | Rank | Child Poverty Under the Age of 16 |
| Bolivians | 99.8 /100 | #26 | Exceptional 13.2% |
| Immigrants | China | 99.8 /100 | #27 | Exceptional 13.3% |
| Assyrians/Chaldeans/Syriacs | 99.7 /100 | #28 | Exceptional 13.3% |
| Swedes | 99.7 /100 | #29 | Exceptional 13.3% |
| Turks | 99.7 /100 | #30 | Exceptional 13.4% |
| Danes | 99.7 /100 | #31 | Exceptional 13.4% |
| Tongans | 99.7 /100 | #32 | Exceptional 13.4% |
| Asians | 99.6 /100 | #33 | Exceptional 13.5% |
| Russians | 99.6 /100 | #34 | Exceptional 13.5% |
| Lithuanians | 99.6 /100 | #35 | Exceptional 13.5% |
| Immigrants | Northern Europe | 99.6 /100 | #36 | Exceptional 13.6% |
| Immigrants | Bolivia | 99.6 /100 | #37 | Exceptional 13.6% |
| Luxembourgers | 99.5 /100 | #38 | Exceptional 13.6% |
| Immigrants | Australia | 99.5 /100 | #39 | Exceptional 13.6% |
| Immigrants | Scotland | 99.4 /100 | #40 | Exceptional 13.7% |
Demographics Similar to Hawaiians by Child Poverty Under the Age of 16
In terms of child poverty under the age of 16, the demographic groups most similar to Hawaiians are Celtic (16.4%, a difference of 0.010%), Immigrants from Western Asia (16.4%, a difference of 0.030%), Immigrants from Bosnia and Herzegovina (16.5%, a difference of 0.11%), Immigrants from South America (16.4%, a difference of 0.32%), and South American Indian (16.4%, a difference of 0.45%).
| Demographics | Rating | Rank | Child Poverty Under the Age of 16 |
| Scotch-Irish | 47.1 /100 | #175 | Average 16.3% |
| Lebanese | 45.9 /100 | #176 | Average 16.3% |
| Ethiopians | 43.4 /100 | #177 | Average 16.3% |
| Immigrants | Ethiopia | 42.3 /100 | #178 | Average 16.4% |
| Immigrants | Syria | 42.3 /100 | #179 | Average 16.4% |
| South American Indians | 41.8 /100 | #180 | Average 16.4% |
| Immigrants | South America | 40.8 /100 | #181 | Average 16.4% |
| Hawaiians | 38.2 /100 | #182 | Fair 16.4% |
| Celtics | 38.2 /100 | #183 | Fair 16.4% |
| Immigrants | Western Asia | 38.0 /100 | #184 | Fair 16.4% |
| Immigrants | Bosnia and Herzegovina | 37.4 /100 | #185 | Fair 16.5% |
| Kenyans | 34.1 /100 | #186 | Fair 16.5% |
| Arabs | 31.4 /100 | #187 | Fair 16.6% |
| Immigrants | Morocco | 31.2 /100 | #188 | Fair 16.6% |
| Immigrants | Portugal | 30.0 /100 | #189 | Fair 16.6% |