Armenian vs Pueblo Child Poverty Among Girls Under 16
COMPARE
Armenian
Pueblo
Child Poverty Among Girls Under 16
Child Poverty Among Girls Under 16 Comparison
Armenians
Pueblo
15.5%
CHILD POVERTY AMONG GIRLS UNDER 16
87.9/ 100
METRIC RATING
139th/ 347
METRIC RANK
25.2%
CHILD POVERTY AMONG GIRLS UNDER 16
0.0/ 100
METRIC RATING
335th/ 347
METRIC RANK
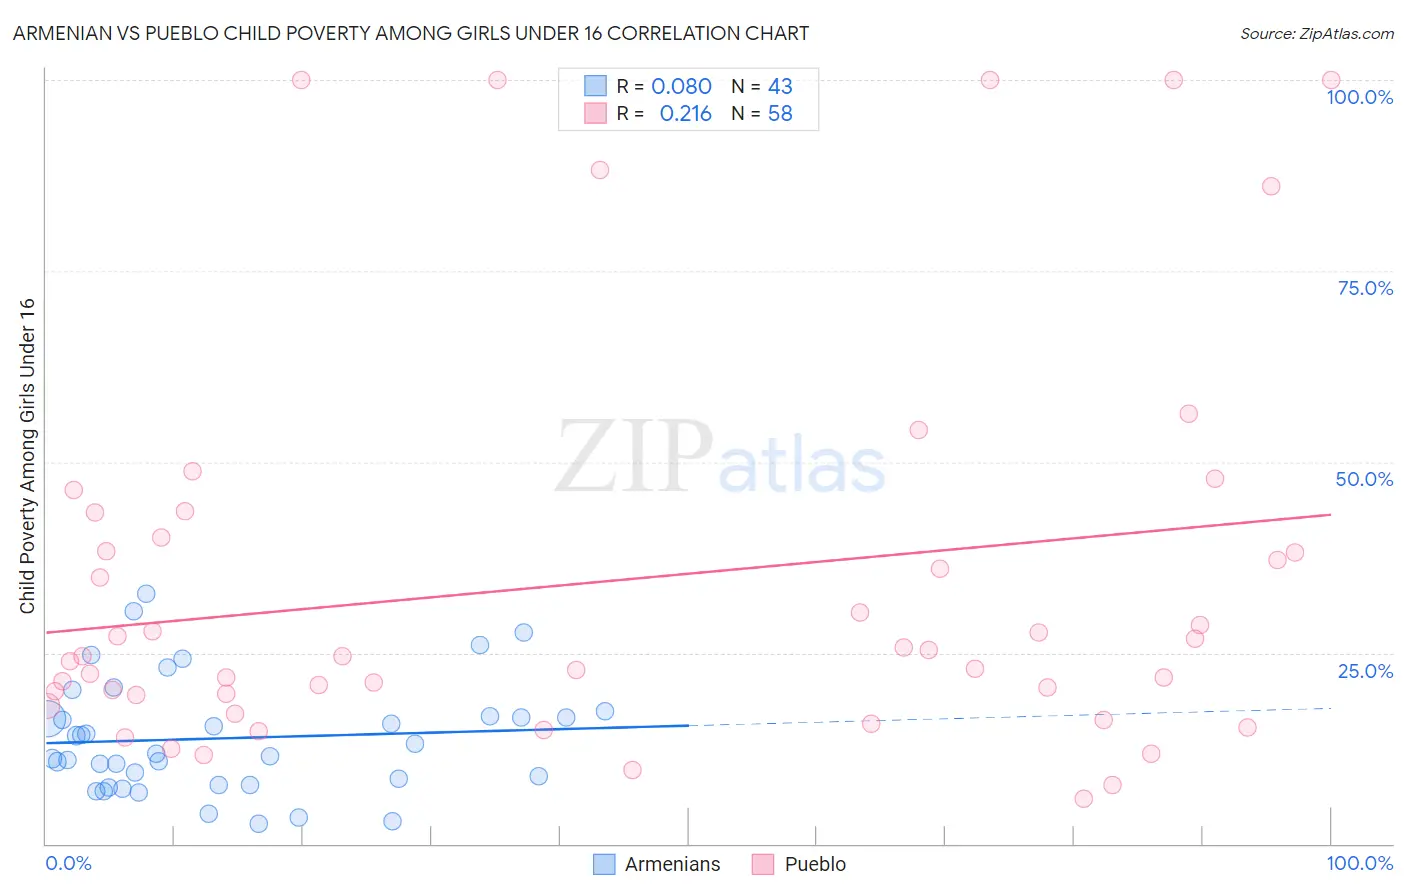
Armenian vs Pueblo Child Poverty Among Girls Under 16 Correlation Chart
The statistical analysis conducted on geographies consisting of 304,744,941 people shows a slight positive correlation between the proportion of Armenians and poverty level among girls under the age of 16 in the United States with a correlation coefficient (R) of 0.080 and weighted average of 15.5%. Similarly, the statistical analysis conducted on geographies consisting of 119,548,196 people shows a weak positive correlation between the proportion of Pueblo and poverty level among girls under the age of 16 in the United States with a correlation coefficient (R) of 0.216 and weighted average of 25.2%, a difference of 62.3%.
Child Poverty Among Girls Under 16 Correlation Summary
| Measurement | Armenian | Pueblo |
| Minimum | 2.6% | 5.9% |
| Maximum | 32.7% | 100.0% |
| Range | 30.1% | 94.1% |
| Mean | 13.8% | 34.3% |
| Median | 11.7% | 24.5% |
| Interquartile 25% (IQ1) | 7.7% | 19.5% |
| Interquartile 75% (IQ3) | 16.7% | 40.1% |
| Interquartile Range (IQR) | 9.0% | 20.5% |
| Standard Deviation (Sample) | 7.4% | 25.9% |
| Standard Deviation (Population) | 7.3% | 25.7% |
Similar Demographics by Child Poverty Among Girls Under 16
Demographics Similar to Armenians by Child Poverty Among Girls Under 16
In terms of child poverty among girls under 16, the demographic groups most similar to Armenians are Immigrants from Vietnam (15.5%, a difference of 0.10%), New Zealander (15.6%, a difference of 0.18%), Immigrants from Jordan (15.6%, a difference of 0.19%), Canadian (15.6%, a difference of 0.21%), and South African (15.5%, a difference of 0.23%).
| Demographics | Rating | Rank | Child Poverty Among Girls Under 16 |
| Mongolians | 89.7 /100 | #132 | Excellent 15.4% |
| Brazilians | 89.6 /100 | #133 | Excellent 15.4% |
| Immigrants | Spain | 89.1 /100 | #134 | Excellent 15.5% |
| Czechoslovakians | 89.0 /100 | #135 | Excellent 15.5% |
| Native Hawaiians | 89.0 /100 | #136 | Excellent 15.5% |
| South Africans | 88.7 /100 | #137 | Excellent 15.5% |
| Immigrants | Vietnam | 88.2 /100 | #138 | Excellent 15.5% |
| Armenians | 87.9 /100 | #139 | Excellent 15.5% |
| New Zealanders | 87.2 /100 | #140 | Excellent 15.6% |
| Immigrants | Jordan | 87.2 /100 | #141 | Excellent 15.6% |
| Canadians | 87.1 /100 | #142 | Excellent 15.6% |
| Immigrants | Peru | 86.6 /100 | #143 | Excellent 15.6% |
| Israelis | 86.3 /100 | #144 | Excellent 15.6% |
| Welsh | 85.4 /100 | #145 | Excellent 15.6% |
| Samoans | 84.2 /100 | #146 | Excellent 15.7% |
Demographics Similar to Pueblo by Child Poverty Among Girls Under 16
In terms of child poverty among girls under 16, the demographic groups most similar to Pueblo are Menominee (25.0%, a difference of 0.70%), Sioux (25.6%, a difference of 1.5%), Black/African American (24.7%, a difference of 2.2%), Yup'ik (25.8%, a difference of 2.4%), and Cheyenne (26.3%, a difference of 4.3%).
| Demographics | Rating | Rank | Child Poverty Among Girls Under 16 |
| Dominicans | 0.0 /100 | #328 | Tragic 23.7% |
| Kiowa | 0.0 /100 | #329 | Tragic 23.7% |
| Immigrants | Dominican Republic | 0.0 /100 | #330 | Tragic 23.8% |
| Apache | 0.0 /100 | #331 | Tragic 23.8% |
| Natives/Alaskans | 0.0 /100 | #332 | Tragic 24.0% |
| Blacks/African Americans | 0.0 /100 | #333 | Tragic 24.7% |
| Menominee | 0.0 /100 | #334 | Tragic 25.0% |
| Pueblo | 0.0 /100 | #335 | Tragic 25.2% |
| Sioux | 0.0 /100 | #336 | Tragic 25.6% |
| Yup'ik | 0.0 /100 | #337 | Tragic 25.8% |
| Cheyenne | 0.0 /100 | #338 | Tragic 26.3% |
| Crow | 0.0 /100 | #339 | Tragic 26.4% |
| Yuman | 0.0 /100 | #340 | Tragic 27.1% |
| Hopi | 0.0 /100 | #341 | Tragic 27.9% |
| Pima | 0.0 /100 | #342 | Tragic 28.2% |