Armenian vs Mongolian Receiving Food Stamps

COMPARE

Armenian
Race
Ancestry
AfghanAfricanAlaska NativeAlaskan AthabascanAlbanianAleutAlsatianAmericanApacheArabArapahoArgentineanArmenianAssyrian/Chaldean/SyriacAustralianAustrianBahamianBangladeshiBarbadianBasqueBelgianBelizeanBermudanBhutaneseBlackfeetBolivianBrazilianBritishBritish West IndianBulgarianBurmeseCajunCambodianCanadianCape VerdeanCarpatho RusynCelticCentral AmericanCentral American IndianCherokeeCheyenneChickasawChileanChineseChippewaChoctawColombianColvilleComancheCosta RicanCreeCreekCroatianCrowCubanCypriotCzechCzechoslovakianDanishDelawareDominicanDutchDutch West IndianEastern EuropeanEcuadorianEgyptianEnglishEstonianEthiopianEuropeanFijianFilipinoFinnishFrenchFrench American IndianFrench CanadianGermanGerman RussianGhanaianGreekGuamanian/ChamorroGuatemalanGuyaneseHaitianHmongHonduranHopiHoumaHungarianIcelanderIndian (Asian)IndonesianInupiatIranianIraqiIrishIroquoisIsraeliItalianJamaicanJapaneseJordanianKenyanKiowaKoreanLaotianLatvianLebaneseLiberianLithuanianLumbeeLuxembourgerMacedonianMalaysianMalteseMarshalleseMenomineeMexicanMexican American IndianMoroccanNative HawaiianNavajoNepaleseNew ZealanderNicaraguanNigerianNorthern EuropeanNorwegianOkinawanOsageOttawaPaiutePakistaniPalestinianPanamanianParaguayanPennsylvania GermanPeruvianPimaPolishPortuguesePotawatomiPuebloPuerto RicanPuget Sound SalishRomanianRussianSalvadoranSamoanScandinavianScotch-IrishScottishSeminoleSenegaleseSerbianShoshoneSierra LeoneanSiouxSlavicSlovakSloveneSomaliSouth AfricanSouth AmericanSouth American IndianSoviet UnionSpaniardSpanishSpanish AmericanSpanish American IndianSri LankanSubsaharan AfricanSudaneseSwedishSwissSyrianTaiwaneseThaiTlingit-HaidaTohono O'OdhamTonganTrinidadian and TobagonianTsimshianTurkishU.S. Virgin IslanderUgandanUkrainianUruguayanUteVenezuelanVietnameseWelshWest IndianYakamaYaquiYugoslavianYumanYup'ikZimbabwean
Immigration
NonimmigrantsImmigrantsAfghanistanAfricaAlbaniaArgentinaArmeniaAsiaAustraliaAustriaBahamasBangladeshBarbadosBelarusBelgiumBelizeBoliviaBosnia and HerzegovinaBrazilBulgariaBurma/MyanmarCabo VerdeCambodiaCameroonCanadaCaribbeanCentral AmericaChileChinaColombiaCongoCosta RicaCroatiaCubaCzechoslovakiaDenmarkDominicaDominican RepublicEastern AfricaEastern AsiaEastern EuropeEcuadorEgyptEl SalvadorEnglandEritreaEthiopiaEuropeFijiFranceGermanyGhanaGreeceGrenadaGuatemalaGuyanaHaitiHondurasHong KongHungaryIndiaIndonesiaIranIraqIrelandIsraelItalyJamaicaJapanJordanKazakhstanKenyaKoreaKuwaitLaosLatin AmericaLatviaLebanonLiberiaLithuaniaMalaysiaMexicoMicronesiaMiddle AfricaMoldovaMoroccoNepalNetherlandsNicaraguaNigeriaNorth AmericaNorth MacedoniaNorthern AfricaNorthern EuropeNorwayOceaniaPakistanPanamaPeruPhilippinesPolandPortugalRomaniaRussiaSaudi ArabiaScotlandSenegalSerbiaSierra LeoneSingaporeSomaliaSouth AfricaSouth AmericaSouth Central AsiaSouth Eastern AsiaSouthern EuropeSpainSri LankaSt. Vincent and the GrenadinesSudanSwedenSwitzerlandSyriaTaiwanThailandTrinidad and TobagoTurkeyUgandaUkraineUruguayUzbekistanVenezuelaVietnamWest IndiesWestern AfricaWestern AsiaWestern EuropeYemenZaireZimbabweAzores
Mongolian
Race
Ancestry
AfghanAfricanAlaska NativeAlaskan AthabascanAlbanianAleutAlsatianAmericanApacheArabArapahoArgentineanAssyrian/Chaldean/SyriacAustralianAustrianBahamianBangladeshiBarbadianBasqueBelgianBelizeanBermudanBhutaneseBlackfeetBolivianBrazilianBritishBritish West IndianBulgarianBurmeseCajunCambodianCanadianCape VerdeanCarpatho RusynCelticCentral AmericanCentral American IndianCherokeeCheyenneChickasawChileanChineseChippewaChoctawColombianColvilleComancheCosta RicanCreeCreekCroatianCrowCubanCypriotCzechCzechoslovakianDanishDelawareDominicanDutchDutch West IndianEastern EuropeanEcuadorianEgyptianEnglishEstonianEthiopianEuropeanFijianFilipinoFinnishFrenchFrench American IndianFrench CanadianGermanGerman RussianGhanaianGreekGuamanian/ChamorroGuatemalanGuyaneseHaitianHmongHonduranHopiHoumaHungarianIcelanderIndian (Asian)IndonesianInupiatIranianIraqiIrishIroquoisIsraeliItalianJamaicanJapaneseJordanianKenyanKiowaKoreanLaotianLatvianLebaneseLiberianLithuanianLumbeeLuxembourgerMacedonianMalaysianMalteseMarshalleseMenomineeMexicanMexican American IndianMongolianMoroccanNative HawaiianNavajoNepaleseNew ZealanderNicaraguanNigerianNorthern EuropeanNorwegianOkinawanOsageOttawaPaiutePakistaniPalestinianPanamanianParaguayanPennsylvania GermanPeruvianPimaPolishPortuguesePotawatomiPuebloPuerto RicanPuget Sound SalishRomanianRussianSalvadoranSamoanScandinavianScotch-IrishScottishSeminoleSenegaleseSerbianShoshoneSierra LeoneanSiouxSlavicSlovakSloveneSomaliSouth AfricanSouth AmericanSouth American IndianSoviet UnionSpaniardSpanishSpanish AmericanSpanish American IndianSri LankanSubsaharan AfricanSudaneseSwedishSwissSyrianTaiwaneseThaiTlingit-HaidaTohono O'OdhamTonganTrinidadian and TobagonianTsimshianTurkishU.S. Virgin IslanderUgandanUkrainianUruguayanUteVenezuelanVietnameseWelshWest IndianYakamaYaquiYugoslavianYumanYup'ikZimbabwean
Immigration
NonimmigrantsImmigrantsAfghanistanAfricaAlbaniaArgentinaArmeniaAsiaAustraliaAustriaBahamasBangladeshBarbadosBelarusBelgiumBelizeBoliviaBosnia and HerzegovinaBrazilBulgariaBurma/MyanmarCabo VerdeCambodiaCameroonCanadaCaribbeanCentral AmericaChileChinaColombiaCongoCosta RicaCroatiaCubaCzechoslovakiaDenmarkDominicaDominican RepublicEastern AfricaEastern AsiaEastern EuropeEcuadorEgyptEl SalvadorEnglandEritreaEthiopiaEuropeFijiFranceGermanyGhanaGreeceGrenadaGuatemalaGuyanaHaitiHondurasHong KongHungaryIndiaIndonesiaIranIraqIrelandIsraelItalyJamaicaJapanJordanKazakhstanKenyaKoreaKuwaitLaosLatin AmericaLatviaLebanonLiberiaLithuaniaMalaysiaMexicoMicronesiaMiddle AfricaMoldovaMoroccoNepalNetherlandsNicaraguaNigeriaNorth AmericaNorth MacedoniaNorthern AfricaNorthern EuropeNorwayOceaniaPakistanPanamaPeruPhilippinesPolandPortugalRomaniaRussiaSaudi ArabiaScotlandSenegalSerbiaSierra LeoneSingaporeSomaliaSouth AfricaSouth AmericaSouth Central AsiaSouth Eastern AsiaSouthern EuropeSpainSri LankaSt. Vincent and the GrenadinesSudanSwedenSwitzerlandSyriaTaiwanThailandTrinidad and TobagoTurkeyUgandaUkraineUruguayUzbekistanVenezuelaVietnamWest IndiesWestern AfricaWestern AsiaWestern EuropeYemenZaireZimbabweAzores
Receiving Food Stamps
Income
Poverty
Unemployment
Labor Participation
Family Structure
Vehicle Availability
Education Level
Disability

Receiving Food Stamps Comparison

Armenians

Mongolians

Excellent
Exceptional
11.1%
RECEIVING FOOD STAMPS
81.4/ 100
METRIC RATING
154th/ 347
METRIC RANK
10.5%
RECEIVING FOOD STAMPS
95.8/ 100
METRIC RATING
112th/ 347
METRIC RANK

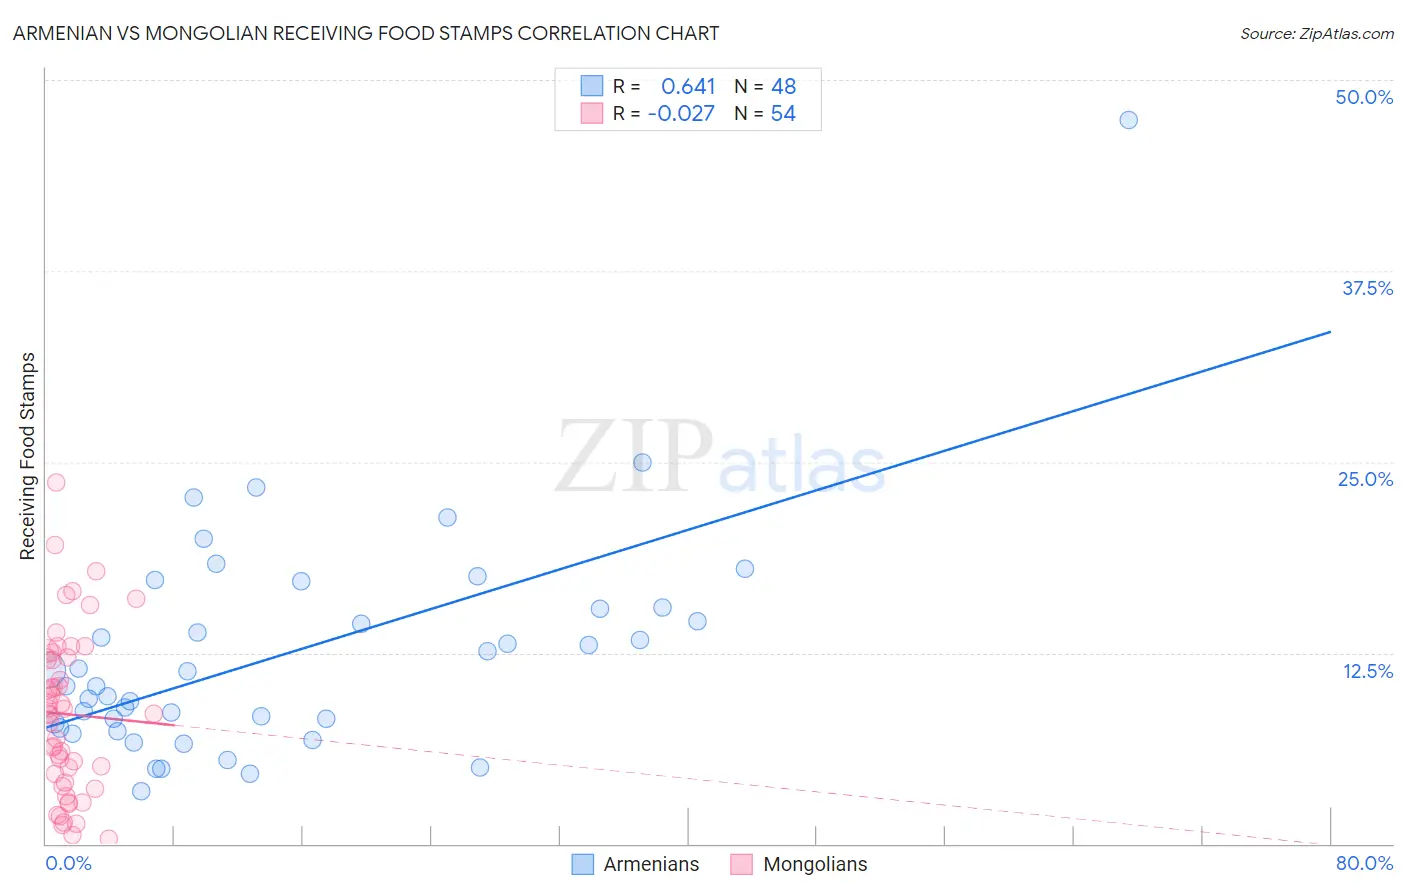
Armenian vs Mongolian Receiving Food Stamps Correlation Chart

The statistical analysis conducted on geographies consisting of 309,974,656 people shows a significant positive correlation between the proportion of Armenians and percentage of population receiving government assistance and/or food stamps in the United States with a correlation coefficient (R) of 0.641 and weighted average of 11.1%. Similarly, the statistical analysis conducted on geographies consisting of 140,177,644 people shows no correlation between the proportion of Mongolians and percentage of population receiving government assistance and/or food stamps in the United States with a correlation coefficient (R) of -0.027 and weighted average of 10.5%, a difference of 6.5%.
Armenian vs Mongolian Receiving Food Stamps

Receiving Food Stamps Correlation Summary

MeasurementArmenianMongolian
Minimum3.5%0.30%
Maximum47.4%23.7%
Range43.9%23.4%
Mean12.5%8.5%
Median10.8%8.5%
Interquartile 25% (IQ1)7.7%4.0%
Interquartile 75% (IQ3)15.4%12.2%
Interquartile Range (IQR)7.7%8.2%
Standard Deviation (Sample)7.4%5.3%
Standard Deviation (Population)7.4%5.3%

Similar Demographics by Receiving Food Stamps

Demographics Similar to Armenians by Receiving Food Stamps

In terms of receiving food stamps, the demographic groups most similar to Armenians are Lebanese (11.1%, a difference of 0.060%), Immigrants from Kazakhstan (11.1%, a difference of 0.080%), Immigrants from Spain (11.1%, a difference of 0.090%), Immigrants from Argentina (11.2%, a difference of 0.25%), and Soviet Union (11.1%, a difference of 0.45%).
DemographicsRating | RankReceiving Food Stamps
Whites/Caucasians
83.9
/100
|
#147
Excellent
11.1%
Immigrants | South Eastern Asia
83.3
/100
|
#148
Excellent
11.1%
Brazilians
83.2
/100
|
#149
Excellent
11.1%
Soviet Union
83.1
/100
|
#150
Excellent
11.1%
Immigrants | Spain
81.7
/100
|
#151
Excellent
11.1%
Immigrants | Kazakhstan
81.7
/100
|
#152
Excellent
11.1%
Lebanese
81.6
/100
|
#153
Excellent
11.1%
Armenians
81.4
/100
|
#154
Excellent
11.1%
Immigrants | Argentina
80.4
/100
|
#155
Excellent
11.2%
Immigrants | Afghanistan
75.6
/100
|
#156
Good
11.3%
Immigrants | Lebanon
75.2
/100
|
#157
Good
11.3%
Immigrants | Bosnia and Herzegovina
72.6
/100
|
#158
Good
11.3%
Immigrants | Oceania
70.4
/100
|
#159
Good
11.4%
French Canadians
69.5
/100
|
#160
Good
11.4%
Pennsylvania Germans
68.4
/100
|
#161
Good
11.4%

Demographics Similar to Mongolians by Receiving Food Stamps

In terms of receiving food stamps, the demographic groups most similar to Mongolians are Romanian (10.4%, a difference of 0.010%), Pakistani (10.4%, a difference of 0.11%), Icelander (10.5%, a difference of 0.38%), Immigrants from Pakistan (10.4%, a difference of 0.39%), and Carpatho Rusyn (10.4%, a difference of 0.44%).
DemographicsRating | RankReceiving Food Stamps
Immigrants | Malaysia
96.5
/100
|
#105
Exceptional
10.4%
Immigrants | Italy
96.4
/100
|
#106
Exceptional
10.4%
Koreans
96.3
/100
|
#107
Exceptional
10.4%
Carpatho Rusyns
96.2
/100
|
#108
Exceptional
10.4%
Immigrants | Pakistan
96.2
/100
|
#109
Exceptional
10.4%
Pakistanis
95.9
/100
|
#110
Exceptional
10.4%
Romanians
95.8
/100
|
#111
Exceptional
10.4%
Mongolians
95.8
/100
|
#112
Exceptional
10.5%
Icelanders
95.4
/100
|
#113
Exceptional
10.5%
Scotch-Irish
95.1
/100
|
#114
Exceptional
10.5%
Immigrants | Saudi Arabia
94.9
/100
|
#115
Exceptional
10.5%
Canadians
94.8
/100
|
#116
Exceptional
10.5%
Immigrants | Nepal
94.6
/100
|
#117
Exceptional
10.6%
Assyrians/Chaldeans/Syriacs
94.1
/100
|
#118
Exceptional
10.6%
Immigrants | Poland
93.9
/100
|
#119
Exceptional
10.6%