American vs Immigrants from Northern Europe Female Poverty
COMPARE
American
Immigrants from Northern Europe
Female Poverty
Female Poverty Comparison
Americans
Immigrants from Northern Europe
14.6%
FEMALE POVERTY
2.8/ 100
METRIC RATING
224th/ 347
METRIC RANK
11.6%
FEMALE POVERTY
99.6/ 100
METRIC RATING
25th/ 347
METRIC RANK
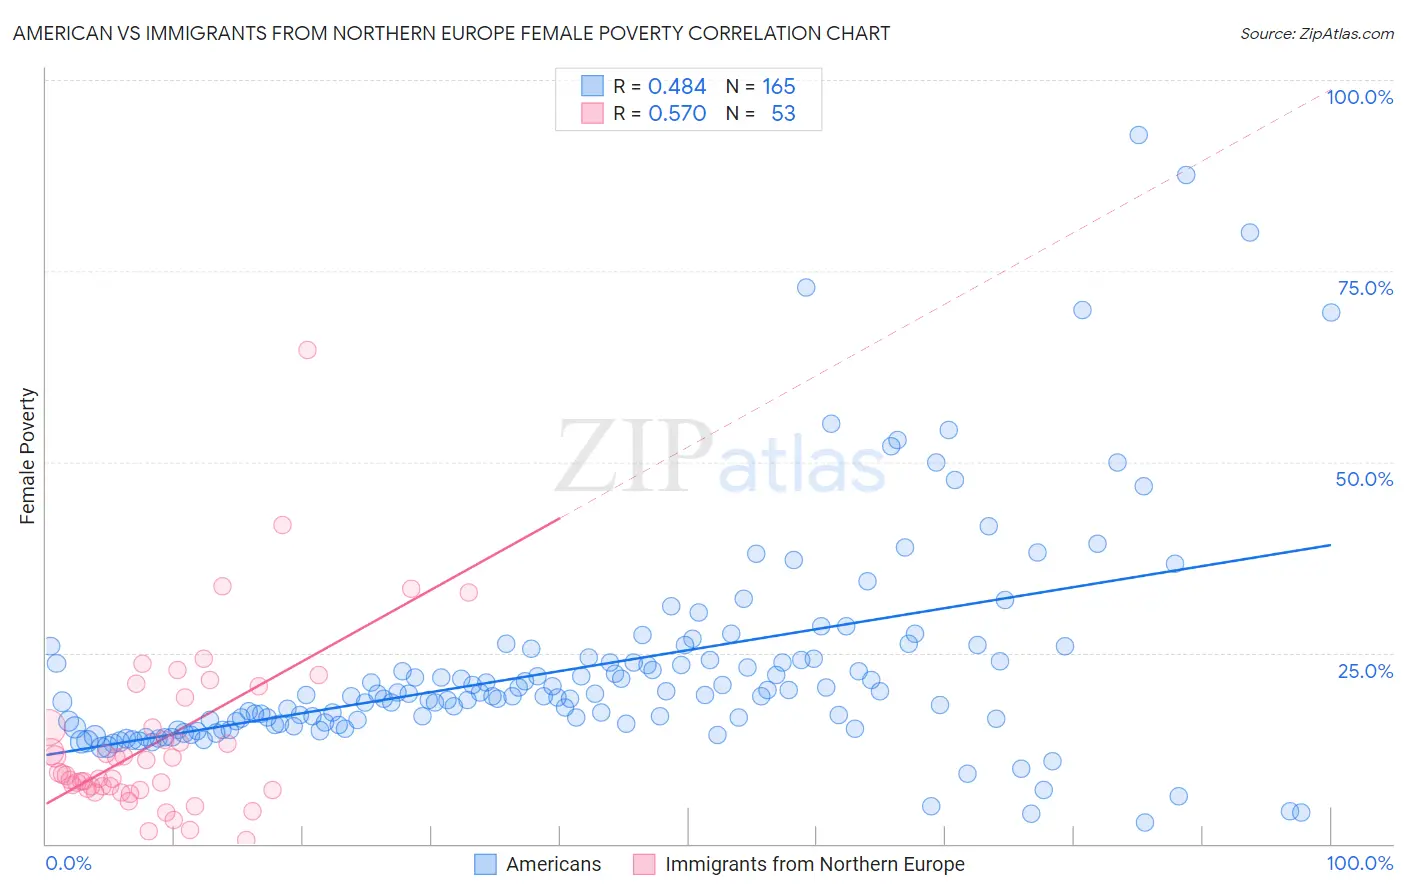
American vs Immigrants from Northern Europe Female Poverty Correlation Chart
The statistical analysis conducted on geographies consisting of 580,452,032 people shows a moderate positive correlation between the proportion of Americans and poverty level among females in the United States with a correlation coefficient (R) of 0.484 and weighted average of 14.6%. Similarly, the statistical analysis conducted on geographies consisting of 476,749,265 people shows a substantial positive correlation between the proportion of Immigrants from Northern Europe and poverty level among females in the United States with a correlation coefficient (R) of 0.570 and weighted average of 11.6%, a difference of 25.3%.
Female Poverty Correlation Summary
| Measurement | American | Immigrants from Northern Europe |
| Minimum | 2.7% | 0.47% |
| Maximum | 92.7% | 64.6% |
| Range | 90.0% | 64.1% |
| Mean | 23.2% | 13.5% |
| Median | 19.4% | 9.1% |
| Interquartile 25% (IQ1) | 15.6% | 7.2% |
| Interquartile 75% (IQ3) | 24.2% | 17.2% |
| Interquartile Range (IQR) | 8.5% | 10.1% |
| Standard Deviation (Sample) | 14.5% | 11.4% |
| Standard Deviation (Population) | 14.5% | 11.3% |
Similar Demographics by Female Poverty
Demographics Similar to Americans by Female Poverty
In terms of female poverty, the demographic groups most similar to Americans are Immigrants from Micronesia (14.6%, a difference of 0.0%), Immigrants from Eritrea (14.6%, a difference of 0.33%), Immigrants from Africa (14.5%, a difference of 0.39%), Nonimmigrants (14.5%, a difference of 0.63%), and Immigrants from Nigeria (14.7%, a difference of 0.64%).
| Demographics | Rating | Rank | Female Poverty |
| Immigrants | Immigrants | 4.5 /100 | #217 | Tragic 14.4% |
| Immigrants | Uzbekistan | 4.4 /100 | #218 | Tragic 14.4% |
| Japanese | 4.1 /100 | #219 | Tragic 14.5% |
| Alsatians | 4.0 /100 | #220 | Tragic 14.5% |
| Immigrants | Cambodia | 3.7 /100 | #221 | Tragic 14.5% |
| Immigrants | Nonimmigrants | 3.7 /100 | #222 | Tragic 14.5% |
| Immigrants | Africa | 3.3 /100 | #223 | Tragic 14.5% |
| Americans | 2.8 /100 | #224 | Tragic 14.6% |
| Immigrants | Micronesia | 2.8 /100 | #225 | Tragic 14.6% |
| Immigrants | Eritrea | 2.4 /100 | #226 | Tragic 14.6% |
| Immigrants | Nigeria | 2.1 /100 | #227 | Tragic 14.7% |
| German Russians | 2.0 /100 | #228 | Tragic 14.7% |
| Ghanaians | 1.9 /100 | #229 | Tragic 14.7% |
| Alaska Natives | 1.8 /100 | #230 | Tragic 14.7% |
| Nigerians | 1.7 /100 | #231 | Tragic 14.8% |
Demographics Similar to Immigrants from Northern Europe by Female Poverty
In terms of female poverty, the demographic groups most similar to Immigrants from Northern Europe are Croatian (11.6%, a difference of 0.0%), Iranian (11.7%, a difference of 0.11%), Luxembourger (11.6%, a difference of 0.26%), Burmese (11.6%, a difference of 0.28%), and Immigrants from Korea (11.7%, a difference of 0.32%).
| Demographics | Rating | Rank | Female Poverty |
| Immigrants | Scotland | 99.8 /100 | #18 | Exceptional 11.5% |
| Norwegians | 99.8 /100 | #19 | Exceptional 11.5% |
| Eastern Europeans | 99.7 /100 | #20 | Exceptional 11.5% |
| Italians | 99.7 /100 | #21 | Exceptional 11.6% |
| Swedes | 99.7 /100 | #22 | Exceptional 11.6% |
| Burmese | 99.7 /100 | #23 | Exceptional 11.6% |
| Luxembourgers | 99.7 /100 | #24 | Exceptional 11.6% |
| Immigrants | Northern Europe | 99.6 /100 | #25 | Exceptional 11.6% |
| Croatians | 99.6 /100 | #26 | Exceptional 11.6% |
| Iranians | 99.6 /100 | #27 | Exceptional 11.7% |
| Immigrants | Korea | 99.6 /100 | #28 | Exceptional 11.7% |
| Immigrants | North Macedonia | 99.6 /100 | #29 | Exceptional 11.7% |
| Greeks | 99.5 /100 | #30 | Exceptional 11.7% |
| Poles | 99.5 /100 | #31 | Exceptional 11.7% |
| Danes | 99.5 /100 | #32 | Exceptional 11.7% |