American vs Carpatho Rusyn Single Female Poverty
COMPARE
American
Carpatho Rusyn
Single Female Poverty
Single Female Poverty Comparison
Americans
Carpatho Rusyns
24.5%
SINGLE FEMALE POVERTY
0.0/ 100
METRIC RATING
293rd/ 347
METRIC RANK
20.0%
SINGLE FEMALE POVERTY
96.1/ 100
METRIC RATING
111th/ 347
METRIC RANK
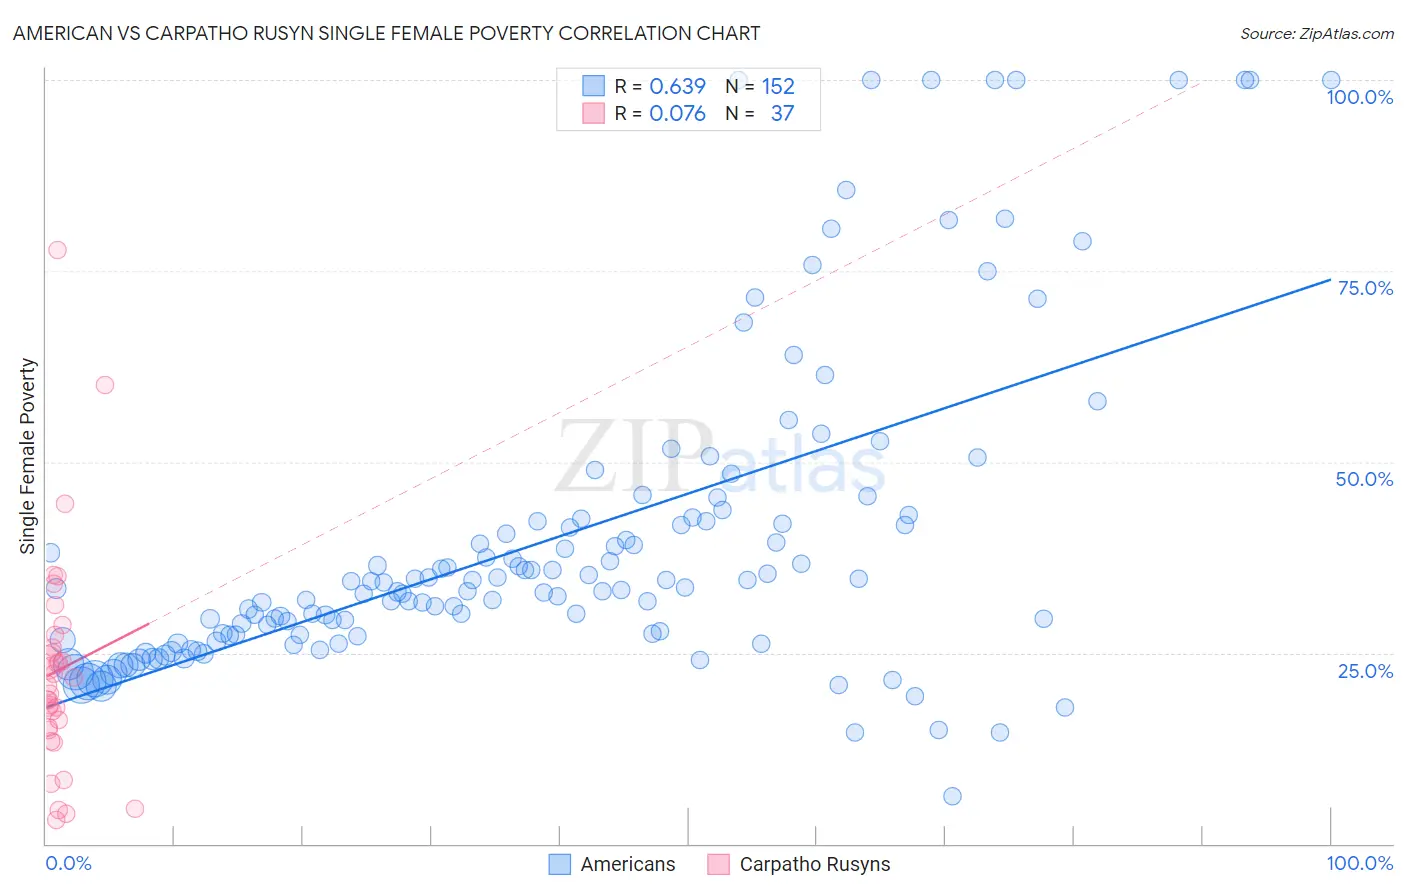
American vs Carpatho Rusyn Single Female Poverty Correlation Chart
The statistical analysis conducted on geographies consisting of 559,828,526 people shows a significant positive correlation between the proportion of Americans and poverty level among single females in the United States with a correlation coefficient (R) of 0.639 and weighted average of 24.5%. Similarly, the statistical analysis conducted on geographies consisting of 58,553,439 people shows a slight positive correlation between the proportion of Carpatho Rusyns and poverty level among single females in the United States with a correlation coefficient (R) of 0.076 and weighted average of 20.0%, a difference of 22.8%.
Single Female Poverty Correlation Summary
| Measurement | American | Carpatho Rusyn |
| Minimum | 6.2% | 3.1% |
| Maximum | 100.0% | 77.8% |
| Range | 93.8% | 74.7% |
| Mean | 39.7% | 22.7% |
| Median | 33.3% | 20.7% |
| Interquartile 25% (IQ1) | 27.3% | 15.1% |
| Interquartile 75% (IQ3) | 42.3% | 26.5% |
| Interquartile Range (IQR) | 15.0% | 11.4% |
| Standard Deviation (Sample) | 20.8% | 14.7% |
| Standard Deviation (Population) | 20.7% | 14.5% |
Similar Demographics by Single Female Poverty
Demographics Similar to Americans by Single Female Poverty
In terms of single female poverty, the demographic groups most similar to Americans are Alsatian (24.5%, a difference of 0.080%), French American Indian (24.6%, a difference of 0.15%), Osage (24.4%, a difference of 0.44%), Hispanic or Latino (24.6%, a difference of 0.49%), and African (24.8%, a difference of 0.98%).
| Demographics | Rating | Rank | Single Female Poverty |
| Cree | 0.0 /100 | #286 | Tragic 24.1% |
| Bangladeshis | 0.0 /100 | #287 | Tragic 24.2% |
| Spanish Americans | 0.0 /100 | #288 | Tragic 24.2% |
| U.S. Virgin Islanders | 0.0 /100 | #289 | Tragic 24.2% |
| Indonesians | 0.0 /100 | #290 | Tragic 24.3% |
| Osage | 0.0 /100 | #291 | Tragic 24.4% |
| Alsatians | 0.0 /100 | #292 | Tragic 24.5% |
| Americans | 0.0 /100 | #293 | Tragic 24.5% |
| French American Indians | 0.0 /100 | #294 | Tragic 24.6% |
| Hispanics or Latinos | 0.0 /100 | #295 | Tragic 24.6% |
| Africans | 0.0 /100 | #296 | Tragic 24.8% |
| Immigrants | Central America | 0.0 /100 | #297 | Tragic 24.8% |
| Yaqui | 0.0 /100 | #298 | Tragic 24.9% |
| Mexicans | 0.0 /100 | #299 | Tragic 25.0% |
| Blackfeet | 0.0 /100 | #300 | Tragic 25.1% |
Demographics Similar to Carpatho Rusyns by Single Female Poverty
In terms of single female poverty, the demographic groups most similar to Carpatho Rusyns are Immigrants from Netherlands (20.0%, a difference of 0.060%), Immigrants from Zimbabwe (20.0%, a difference of 0.12%), Immigrants from Colombia (20.0%, a difference of 0.12%), Immigrants from Northern Africa (20.0%, a difference of 0.14%), and Immigrants from Kazakhstan (20.0%, a difference of 0.17%).
| Demographics | Rating | Rank | Single Female Poverty |
| Chileans | 96.9 /100 | #104 | Exceptional 19.9% |
| Israelis | 96.9 /100 | #105 | Exceptional 19.9% |
| Ethiopians | 96.7 /100 | #106 | Exceptional 19.9% |
| Immigrants | Syria | 96.7 /100 | #107 | Exceptional 19.9% |
| Native Hawaiians | 96.6 /100 | #108 | Exceptional 19.9% |
| Colombians | 96.6 /100 | #109 | Exceptional 19.9% |
| Immigrants | Western Asia | 96.5 /100 | #110 | Exceptional 19.9% |
| Carpatho Rusyns | 96.1 /100 | #111 | Exceptional 20.0% |
| Immigrants | Netherlands | 96.0 /100 | #112 | Exceptional 20.0% |
| Immigrants | Zimbabwe | 95.9 /100 | #113 | Exceptional 20.0% |
| Immigrants | Colombia | 95.9 /100 | #114 | Exceptional 20.0% |
| Immigrants | Northern Africa | 95.8 /100 | #115 | Exceptional 20.0% |
| Immigrants | Kazakhstan | 95.7 /100 | #116 | Exceptional 20.0% |
| Poles | 95.6 /100 | #117 | Exceptional 20.0% |
| Immigrants | Afghanistan | 95.4 /100 | #118 | Exceptional 20.0% |