African vs Native/Alaskan Single Male Poverty
COMPARE
African
Native/Alaskan
Single Male Poverty
Single Male Poverty Comparison
Africans
Natives/Alaskans
14.7%
SINGLE MALE POVERTY
0.0/ 100
METRIC RATING
296th/ 347
METRIC RANK
19.6%
SINGLE MALE POVERTY
0.0/ 100
METRIC RATING
332nd/ 347
METRIC RANK
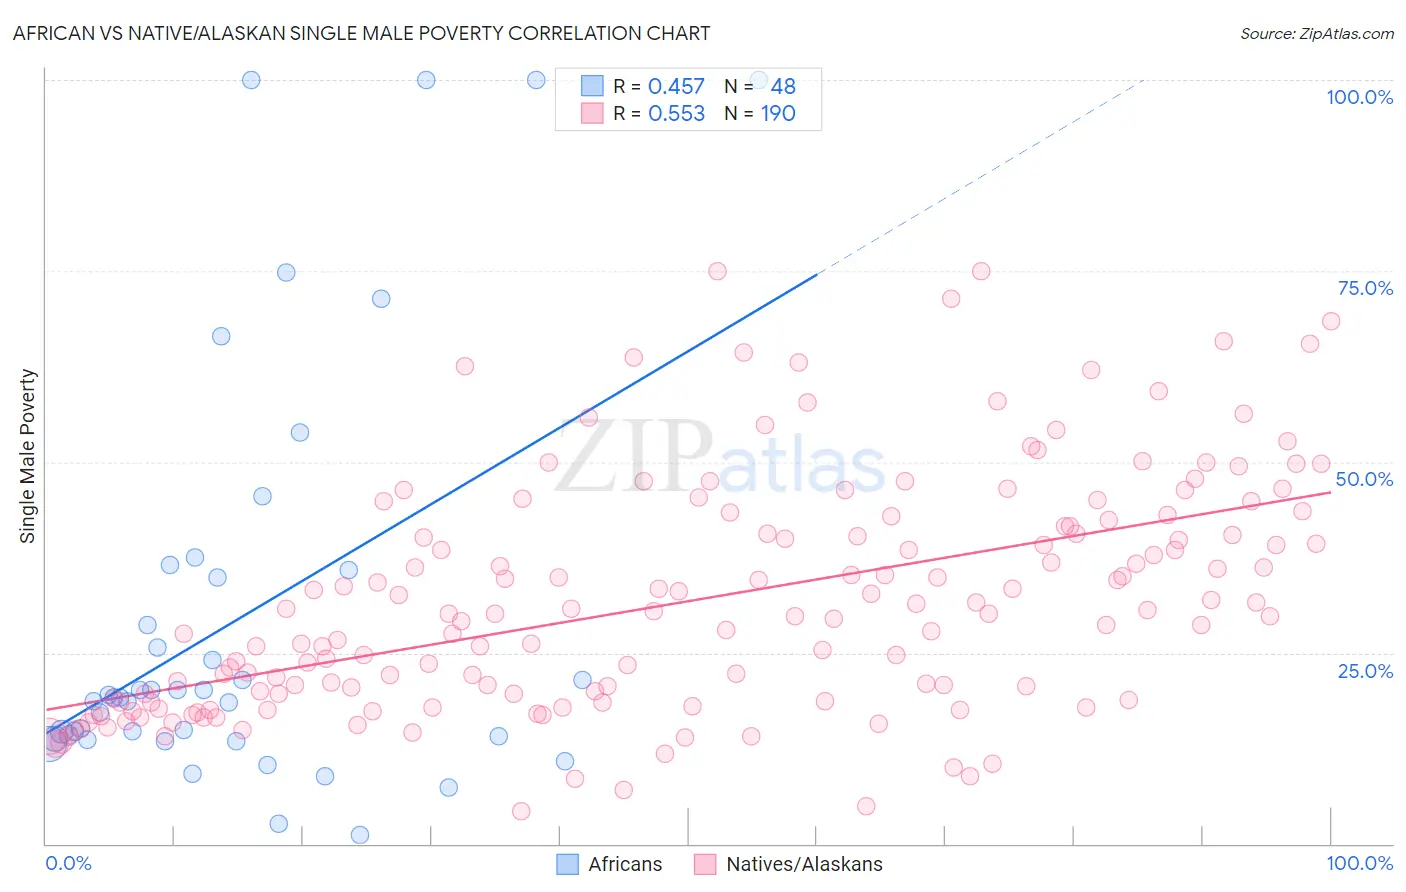
African vs Native/Alaskan Single Male Poverty Correlation Chart
The statistical analysis conducted on geographies consisting of 417,076,777 people shows a moderate positive correlation between the proportion of Africans and poverty level among single males in the United States with a correlation coefficient (R) of 0.457 and weighted average of 14.7%. Similarly, the statistical analysis conducted on geographies consisting of 444,255,067 people shows a substantial positive correlation between the proportion of Natives/Alaskans and poverty level among single males in the United States with a correlation coefficient (R) of 0.553 and weighted average of 19.6%, a difference of 33.2%.
Single Male Poverty Correlation Summary
| Measurement | African | Native/Alaskan |
| Minimum | 1.1% | 4.3% |
| Maximum | 100.0% | 75.0% |
| Range | 98.9% | 70.7% |
| Mean | 29.4% | 31.7% |
| Median | 19.1% | 29.9% |
| Interquartile 25% (IQ1) | 13.9% | 18.7% |
| Interquartile 75% (IQ3) | 35.4% | 41.5% |
| Interquartile Range (IQR) | 21.5% | 22.8% |
| Standard Deviation (Sample) | 26.8% | 15.2% |
| Standard Deviation (Population) | 26.6% | 15.2% |
Similar Demographics by Single Male Poverty
Demographics Similar to Africans by Single Male Poverty
In terms of single male poverty, the demographic groups most similar to Africans are Scotch-Irish (14.7%, a difference of 0.33%), Immigrants from Dominican Republic (14.8%, a difference of 0.35%), Ottawa (14.6%, a difference of 0.77%), French Canadian (14.6%, a difference of 0.95%), and Nonimmigrants (14.6%, a difference of 1.1%).
| Demographics | Rating | Rank | Single Male Poverty |
| Immigrants | Dominica | 0.0 /100 | #289 | Tragic 14.5% |
| U.S. Virgin Islanders | 0.0 /100 | #290 | Tragic 14.5% |
| Bahamians | 0.0 /100 | #291 | Tragic 14.6% |
| Immigrants | Nonimmigrants | 0.0 /100 | #292 | Tragic 14.6% |
| French Canadians | 0.0 /100 | #293 | Tragic 14.6% |
| Ottawa | 0.0 /100 | #294 | Tragic 14.6% |
| Scotch-Irish | 0.0 /100 | #295 | Tragic 14.7% |
| Africans | 0.0 /100 | #296 | Tragic 14.7% |
| Immigrants | Dominican Republic | 0.0 /100 | #297 | Tragic 14.8% |
| French American Indians | 0.0 /100 | #298 | Tragic 15.0% |
| Delaware | 0.0 /100 | #299 | Tragic 15.0% |
| Cree | 0.0 /100 | #300 | Tragic 15.1% |
| Dominicans | 0.0 /100 | #301 | Tragic 15.2% |
| Alsatians | 0.0 /100 | #302 | Tragic 15.2% |
| Aleuts | 0.0 /100 | #303 | Tragic 15.4% |
Demographics Similar to Natives/Alaskans by Single Male Poverty
In terms of single male poverty, the demographic groups most similar to Natives/Alaskans are Paiute (19.3%, a difference of 1.7%), Inupiat (20.0%, a difference of 1.9%), Pima (20.2%, a difference of 2.7%), Cajun (19.1%, a difference of 2.8%), and Colville (18.4%, a difference of 6.4%).
| Demographics | Rating | Rank | Single Male Poverty |
| Choctaw | 0.0 /100 | #325 | Tragic 17.0% |
| Central American Indians | 0.0 /100 | #326 | Tragic 17.2% |
| Menominee | 0.0 /100 | #327 | Tragic 17.7% |
| Kiowa | 0.0 /100 | #328 | Tragic 18.3% |
| Colville | 0.0 /100 | #329 | Tragic 18.4% |
| Cajuns | 0.0 /100 | #330 | Tragic 19.1% |
| Paiute | 0.0 /100 | #331 | Tragic 19.3% |
| Natives/Alaskans | 0.0 /100 | #332 | Tragic 19.6% |
| Inupiat | 0.0 /100 | #333 | Tragic 20.0% |
| Pima | 0.0 /100 | #334 | Tragic 20.2% |
| Yuman | 0.0 /100 | #335 | Tragic 21.3% |
| Tohono O'odham | 0.0 /100 | #336 | Tragic 21.6% |
| Apache | 0.0 /100 | #337 | Tragic 21.6% |
| Pueblo | 0.0 /100 | #338 | Tragic 21.6% |
| Arapaho | 0.0 /100 | #339 | Tragic 21.9% |