Zip Codes with the Most Immigrants from South Eastern Asia in Portland, OR
RELATED REPORTS & OPTIONS
South Eastern Asia
Portland
Compare Zip Codes
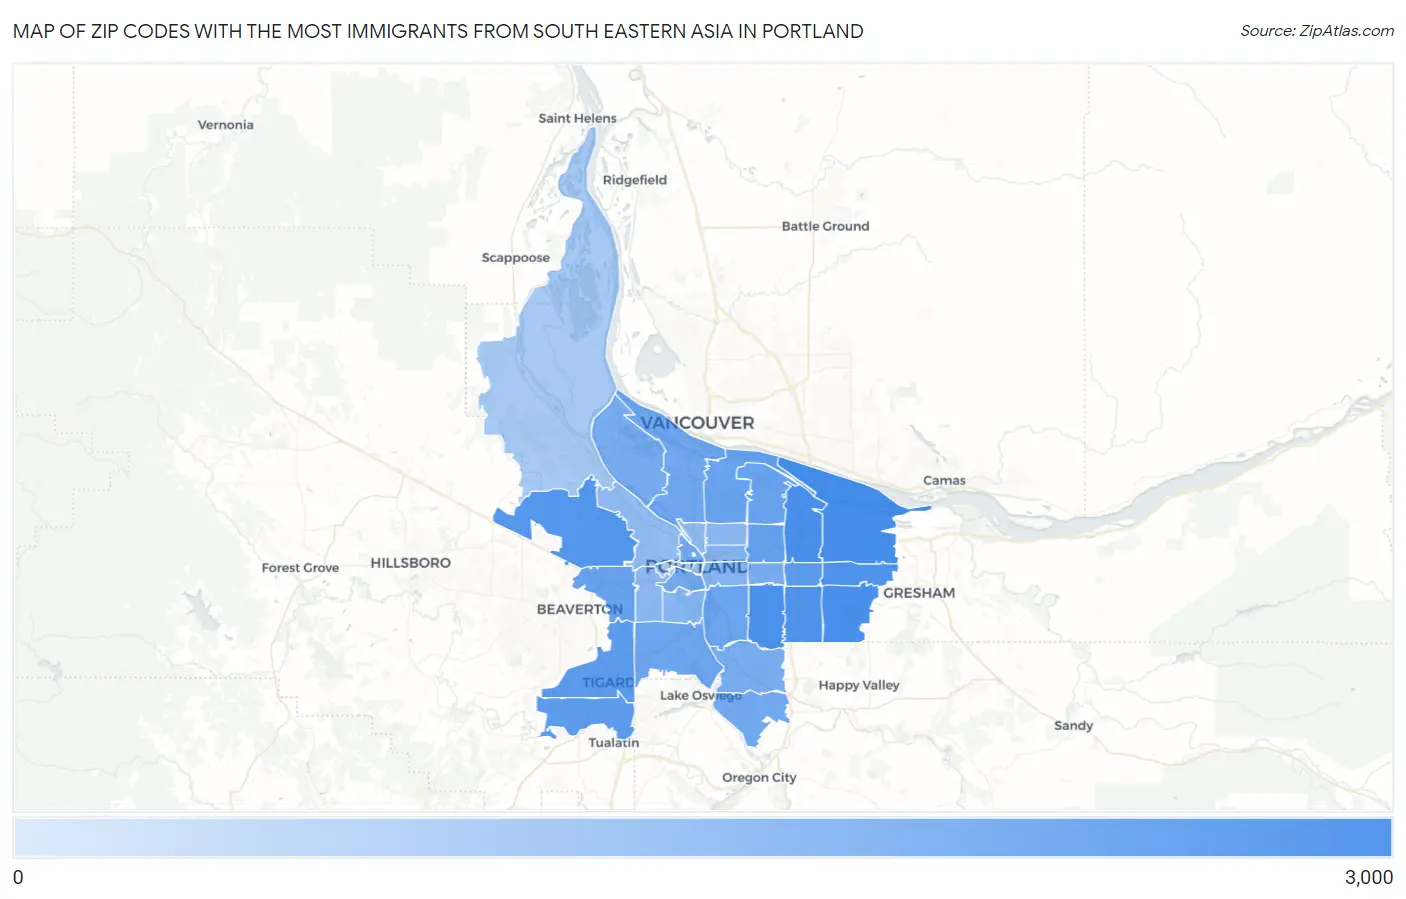
Map of Zip Codes with the Most Immigrants from South Eastern Asia in Portland
0
3,000
Zip Codes with the Most Immigrants from South Eastern Asia in Portland, OR
| Zip Code | South Eastern Asia | vs State | vs National | |
| 1. | 97230 | 2,941 | 49,461(5.95%)#1 | 4,292,058(0.07%)#219 |
| 2. | 97236 | 2,551 | 49,461(5.16%)#2 | 4,292,058(0.06%)#278 |
| 3. | 97220 | 2,534 | 49,461(5.12%)#3 | 4,292,058(0.06%)#283 |
| 4. | 97206 | 2,174 | 49,461(4.40%)#4 | 4,292,058(0.05%)#354 |
| 5. | 97266 | 2,006 | 49,461(4.06%)#6 | 4,292,058(0.05%)#404 |
| 6. | 97233 | 1,974 | 49,461(3.99%)#7 | 4,292,058(0.05%)#415 |
| 7. | 97229 | 1,452 | 49,461(2.94%)#9 | 4,292,058(0.03%)#592 |
| 8. | 97216 | 1,125 | 49,461(2.27%)#13 | 4,292,058(0.03%)#829 |
| 9. | 97223 | 1,042 | 49,461(2.11%)#14 | 4,292,058(0.02%)#917 |
| 10. | 97224 | 892 | 49,461(1.80%)#15 | 4,292,058(0.02%)#1,108 |
| 11. | 97213 | 580 | 49,461(1.17%)#20 | 4,292,058(0.01%)#1,682 |
| 12. | 97225 | 512 | 49,461(1.04%)#24 | 4,292,058(0.01%)#1,888 |
| 13. | 97211 | 481 | 49,461(0.97%)#26 | 4,292,058(0.01%)#2,003 |
| 14. | 97218 | 469 | 49,461(0.95%)#28 | 4,292,058(0.01%)#2,057 |
| 15. | 97202 | 427 | 49,461(0.86%)#30 | 4,292,058(0.01%)#2,229 |
| 16. | 97219 | 349 | 49,461(0.71%)#35 | 4,292,058(0.01%)#2,626 |
| 17. | 97217 | 311 | 49,461(0.63%)#39 | 4,292,058(0.01%)#2,874 |
| 18. | 97201 | 297 | 49,461(0.60%)#40 | 4,292,058(0.01%)#2,980 |
| 19. | 97209 | 296 | 49,461(0.60%)#41 | 4,292,058(0.01%)#2,985 |
| 20. | 97267 | 293 | 49,461(0.59%)#44 | 4,292,058(0.01%)#3,014 |
| 21. | 97203 | 233 | 49,461(0.47%)#49 | 4,292,058(0.01%)#3,604 |
| 22. | 97215 | 202 | 49,461(0.41%)#57 | 4,292,058(0.00%)#3,998 |
| 23. | 97222 | 195 | 49,461(0.39%)#59 | 4,292,058(0.00%)#4,083 |
| 24. | 97214 | 112 | 49,461(0.23%)#76 | 4,292,058(0.00%)#5,605 |
| 25. | 97232 | 110 | 49,461(0.22%)#77 | 4,292,058(0.00%)#5,654 |
| 26. | 97239 | 88 | 49,461(0.18%)#90 | 4,292,058(0.00%)#6,263 |
| 27. | 97221 | 76 | 49,461(0.15%)#92 | 4,292,058(0.00%)#6,656 |
| 28. | 97212 | 74 | 49,461(0.15%)#93 | 4,292,058(0.00%)#6,719 |
| 29. | 97227 | 64 | 49,461(0.13%)#96 | 4,292,058(0.00%)#7,135 |
| 30. | 97210 | 50 | 49,461(0.10%)#107 | 4,292,058(0.00%)#7,792 |
| 31. | 97204 | 41 | 49,461(0.08%)#119 | 4,292,058(0.00%)#8,384 |
| 32. | 97205 | 20 | 49,461(0.04%)#140 | 4,292,058(0.00%)#10,279 |
| 33. | 97231 | 16 | 49,461(0.03%)#149 | 4,292,058(0.00%)#10,868 |
1
Common Questions
What are the Top 10 Zip Codes with the Most Immigrants from South Eastern Asia in Portland, OR?
Top 10 Zip Codes with the Most Immigrants from South Eastern Asia in Portland, OR are:
What zip code has the Most Immigrants from South Eastern Asia in Portland, OR?
97230 has the Most Immigrants from South Eastern Asia in Portland, OR with 2,941.
What is the Total Immigrants from South Eastern Asia in Portland, OR?
Total Immigrants from South Eastern Asia in Portland is 18,007.
What is the Total Immigrants from South Eastern Asia in Oregon?
Total Immigrants from South Eastern Asia in Oregon is 49,461.
What is the Total Immigrants from South Eastern Asia in the United States?
Total Immigrants from South Eastern Asia in the United States is 4,292,058.