Zip Codes with the Highest Percentage of Population Employed in Life, Physical & Social Science in Portland, OR
RELATED REPORTS & OPTIONS
Life, Physical & Social Science
Portland
Compare Zip Codes
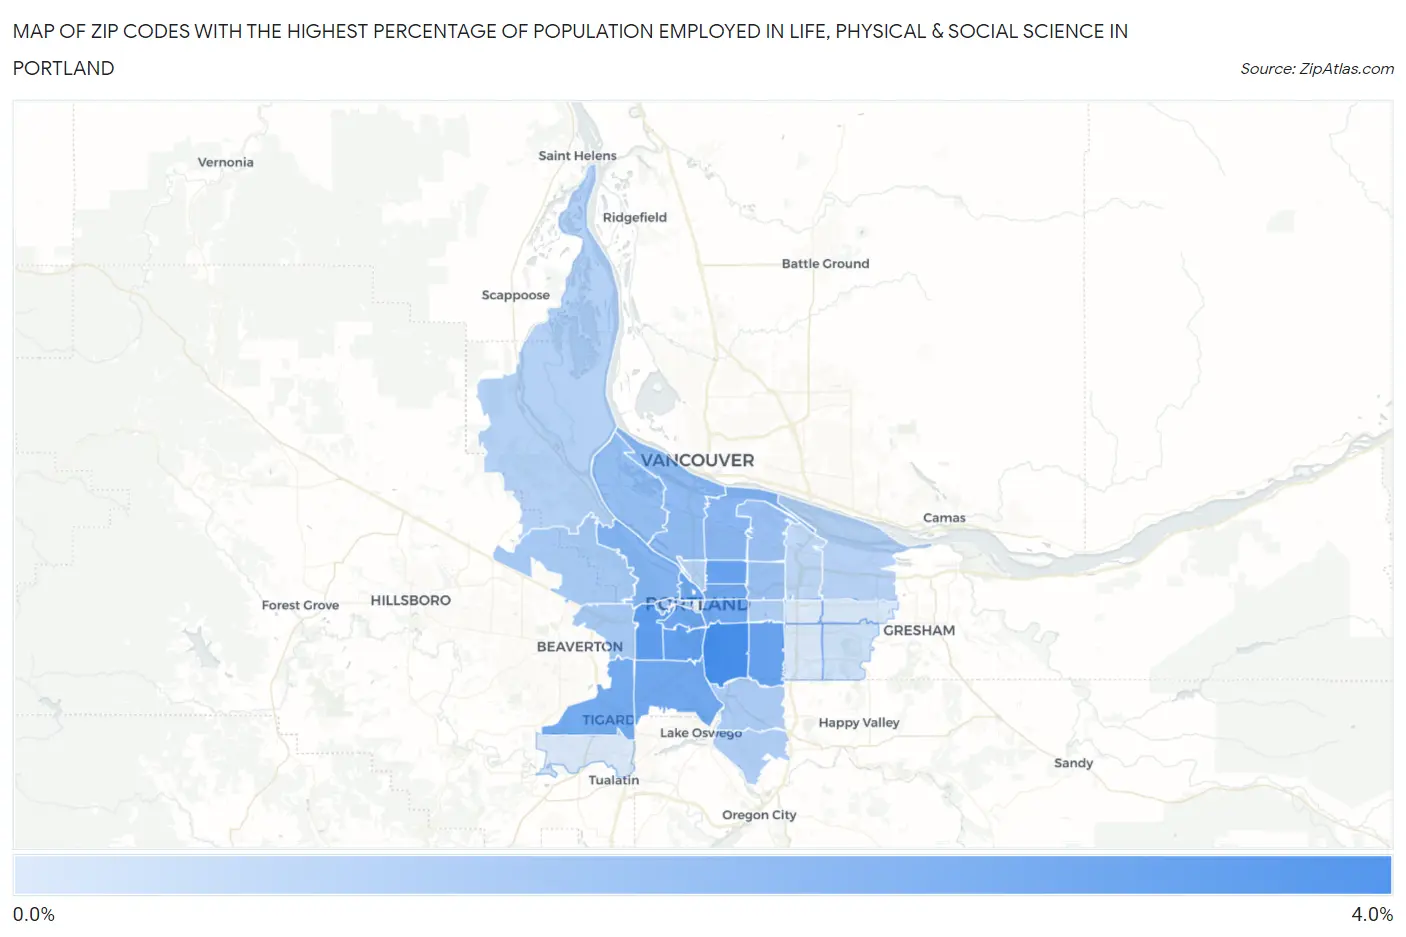
Map of Zip Codes with the Highest Percentage of Population Employed in Life, Physical & Social Science in Portland
0.0%
4.0%
Zip Codes with the Highest Percentage of Population Employed in Life, Physical & Social Science in Portland, OR
| Zip Code | % Employed | vs State | vs National | |
| 1. | 97202 | 3.2% | 1.3%(+1.95)#33 | 1.1%(+2.13)#1,650 |
| 2. | 97221 | 2.8% | 1.3%(+1.49)#38 | 1.1%(+1.68)#2,156 |
| 3. | 97239 | 2.7% | 1.3%(+1.45)#40 | 1.1%(+1.63)#2,217 |
| 4. | 97212 | 2.6% | 1.3%(+1.32)#44 | 1.1%(+1.50)#2,408 |
| 5. | 97206 | 2.6% | 1.3%(+1.29)#45 | 1.1%(+1.47)#2,461 |
| 6. | 97201 | 2.5% | 1.3%(+1.24)#47 | 1.1%(+1.42)#2,549 |
| 7. | 97209 | 2.5% | 1.3%(+1.22)#48 | 1.1%(+1.40)#2,586 |
| 8. | 97214 | 2.5% | 1.3%(+1.18)#49 | 1.1%(+1.36)#2,653 |
| 9. | 97232 | 2.4% | 1.3%(+1.16)#52 | 1.1%(+1.35)#2,676 |
| 10. | 97219 | 2.4% | 1.3%(+1.12)#53 | 1.1%(+1.31)#2,758 |
| 11. | 97223 | 2.3% | 1.3%(+1.07)#54 | 1.1%(+1.26)#2,844 |
| 12. | 97210 | 2.1% | 1.3%(+0.784)#63 | 1.1%(+0.969)#3,516 |
| 13. | 97211 | 2.0% | 1.3%(+0.700)#66 | 1.1%(+0.886)#3,754 |
| 14. | 97217 | 1.8% | 1.3%(+0.563)#72 | 1.1%(+0.749)#4,179 |
| 15. | 97203 | 1.8% | 1.3%(+0.484)#76 | 1.1%(+0.670)#4,474 |
| 16. | 97213 | 1.7% | 1.3%(+0.386)#84 | 1.1%(+0.571)#4,887 |
| 17. | 97218 | 1.6% | 1.3%(+0.361)#87 | 1.1%(+0.546)#5,006 |
| 18. | 97205 | 1.6% | 1.3%(+0.308)#91 | 1.1%(+0.494)#5,226 |
| 19. | 97225 | 1.4% | 1.3%(+0.154)#101 | 1.1%(+0.339)#6,025 |
| 20. | 97229 | 1.4% | 1.3%(+0.135)#103 | 1.1%(+0.321)#6,124 |
| 21. | 97222 | 1.3% | 1.3%(+0.066)#110 | 1.1%(+0.252)#6,509 |
| 22. | 97215 | 1.3% | 1.3%(+0.013)#116 | 1.1%(+0.199)#6,866 |
| 23. | 97267 | 1.3% | 1.3%(+0.011)#117 | 1.1%(+0.197)#6,882 |
| 24. | 97227 | 1.2% | 1.3%(-0.087)#121 | 1.1%(+0.099)#7,566 |
| 25. | 97231 | 1.2% | 1.3%(-0.114)#125 | 1.1%(+0.072)#7,781 |
| 26. | 97230 | 1.1% | 1.3%(-0.157)#131 | 1.1%(+0.029)#8,072 |
| 27. | 97220 | 1.0% | 1.3%(-0.253)#147 | 1.1%(-0.067)#8,849 |
| 28. | 97236 | 0.73% | 1.3%(-0.548)#181 | 1.1%(-0.363)#11,738 |
| 29. | 97233 | 0.56% | 1.3%(-0.716)#210 | 1.1%(-0.530)#13,758 |
| 30. | 97224 | 0.52% | 1.3%(-0.754)#216 | 1.1%(-0.568)#14,231 |
| 31. | 97266 | 0.52% | 1.3%(-0.756)#217 | 1.1%(-0.570)#14,266 |
| 32. | 97216 | 0.46% | 1.3%(-0.814)#225 | 1.1%(-0.629)#14,992 |
1
Common Questions
What are the Top 10 Zip Codes with the Highest Percentage of Population Employed in Life, Physical & Social Science in Portland, OR?
Top 10 Zip Codes with the Highest Percentage of Population Employed in Life, Physical & Social Science in Portland, OR are:
What zip code has the Highest Percentage of Population Employed in Life, Physical & Social Science in Portland, OR?
97202 has the Highest Percentage of Population Employed in Life, Physical & Social Science in Portland, OR with 3.2%.
What is the Percentage of Population Employed in Life, Physical & Social Science in Portland, OR?
Percentage of Population Employed in Life, Physical & Social Science in Portland is 1.9%.
What is the Percentage of Population Employed in Life, Physical & Social Science in Oregon?
Percentage of Population Employed in Life, Physical & Social Science in Oregon is 1.3%.
What is the Percentage of Population Employed in Life, Physical & Social Science in the United States?
Percentage of Population Employed in Life, Physical & Social Science in the United States is 1.1%.