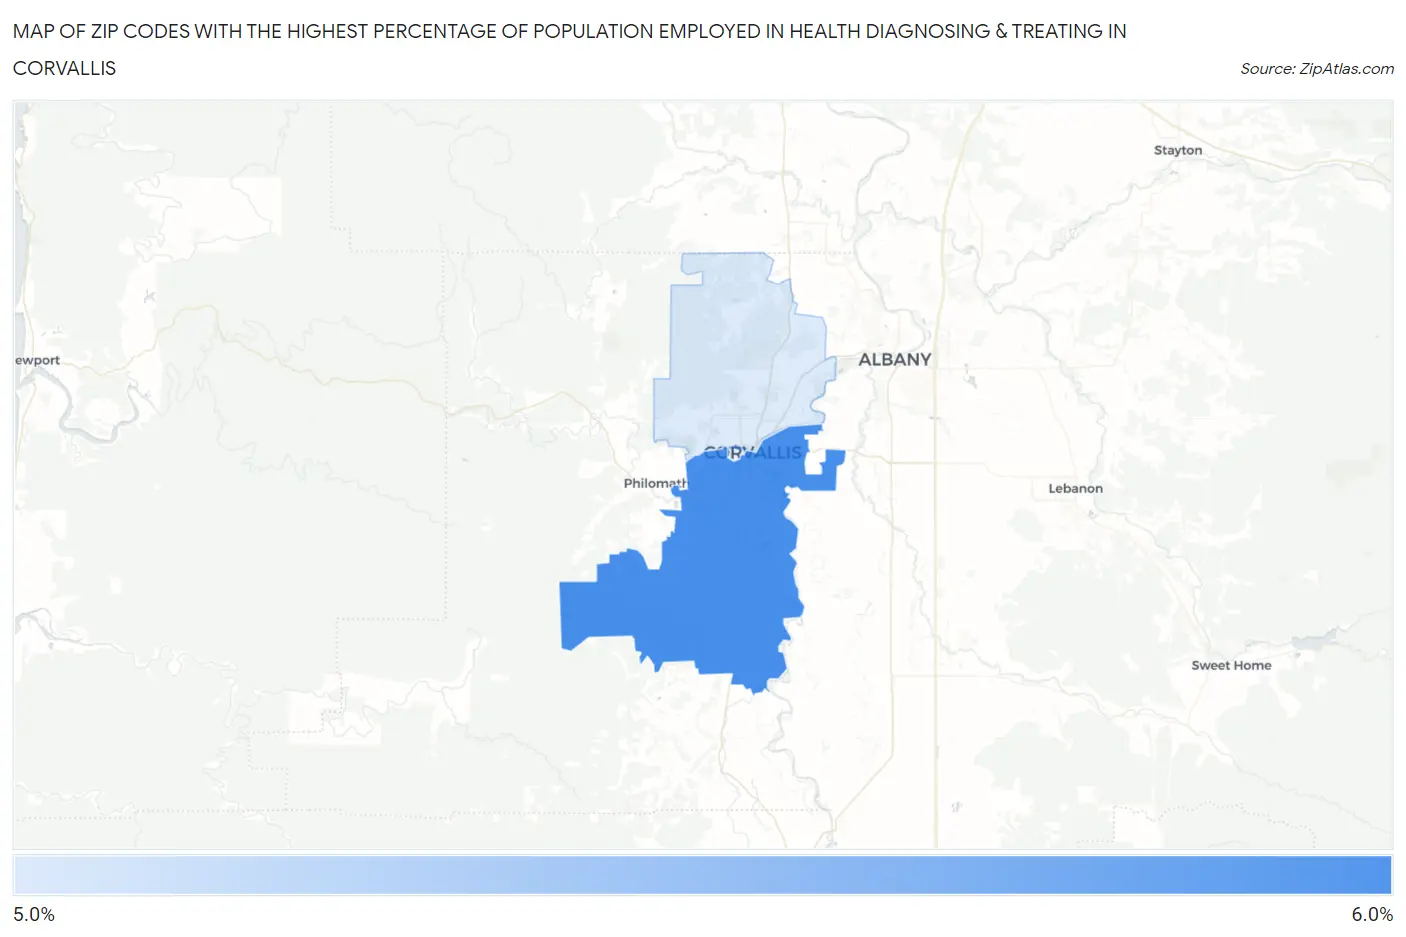
Zip Codes with the Highest Percentage of Population Employed in Health Diagnosing & Treating in Corvallis, OR
RELATED REPORTS & OPTIONS
Health Diagnosing & Treating
Corvallis
Compare Zip Codes
Map of Zip Codes with the Highest Percentage of Population Employed in Health Diagnosing & Treating in Corvallis
0.0%
6.0%
Zip Codes with the Highest Percentage of Population Employed in Health Diagnosing & Treating in Corvallis, OR
| Zip Code | % Employed | vs State | vs National | |
| 1. | 97333 | 5.5% | 6.1%(-0.583)#145 | 6.2%(-0.759)#15,836 |
| 2. | 97330 | 5.3% | 6.1%(-0.751)#157 | 6.2%(-0.926)#16,482 |
1
Common Questions
What are the Top Zip Codes with the Highest Percentage of Population Employed in Health Diagnosing & Treating in Corvallis, OR?
Top Zip Codes with the Highest Percentage of Population Employed in Health Diagnosing & Treating in Corvallis, OR are:
What zip code has the Highest Percentage of Population Employed in Health Diagnosing & Treating in Corvallis, OR?
97333 has the Highest Percentage of Population Employed in Health Diagnosing & Treating in Corvallis, OR with 5.5%.
What is the Percentage of Population Employed in Health Diagnosing & Treating in Corvallis, OR?
Percentage of Population Employed in Health Diagnosing & Treating in Corvallis is 4.6%.
What is the Percentage of Population Employed in Health Diagnosing & Treating in Oregon?
Percentage of Population Employed in Health Diagnosing & Treating in Oregon is 6.1%.
What is the Percentage of Population Employed in Health Diagnosing & Treating in the United States?
Percentage of Population Employed in Health Diagnosing & Treating in the United States is 6.2%.