Zip Codes with the Highest Unemployment Rate Amomg Youth Under the Age of 25 in New York
RELATED REPORTS & OPTIONS
Highest Unemployment | Youth < 25
New York
Compare Zip Codes
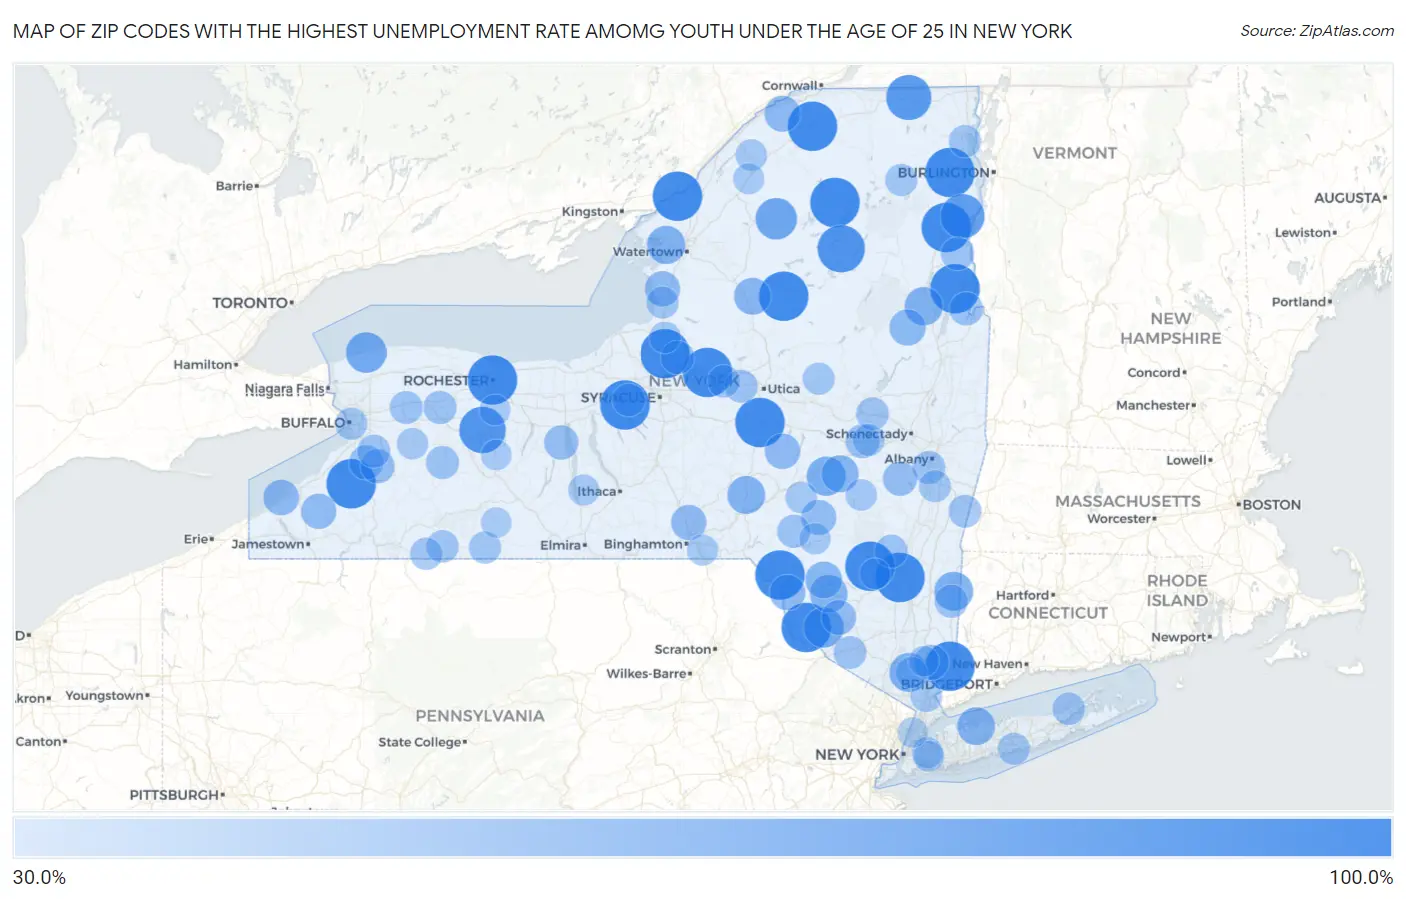
Map of Zip Codes with the Highest Unemployment Rate Amomg Youth Under the Age of 25 in New York
0.0%
100.0%
Zip Codes with the Highest Unemployment Rate Amomg Youth Under the Age of 25 in New York
| Zip Code | Youth Unemployment | vs State | vs National | |
| 1. | 13313 | 100.0% | 13.2%(+86.8)#1 | 10.9%(+89.1)#3 |
| 2. | 13157 | 100.0% | 13.2%(+86.8)#2 | 10.9%(+89.1)#11 |
| 3. | 13697 | 100.0% | 13.2%(+86.8)#3 | 10.9%(+89.1)#25 |
| 4. | 14614 | 100.0% | 13.2%(+86.8)#4 | 10.9%(+89.1)#36 |
| 5. | 12732 | 100.0% | 13.2%(+86.8)#5 | 10.9%(+89.1)#48 |
| 6. | 12836 | 100.0% | 13.2%(+86.8)#6 | 10.9%(+89.1)#79 |
| 7. | 12760 | 100.0% | 13.2%(+86.8)#7 | 10.9%(+89.1)#87 |
| 8. | 12411 | 100.0% | 13.2%(+86.8)#8 | 10.9%(+89.1)#98 |
| 9. | 13472 | 100.0% | 13.2%(+86.8)#9 | 10.9%(+89.1)#102 |
| 10. | 13153 | 100.0% | 13.2%(+86.8)#10 | 10.9%(+89.1)#105 |
| 11. | 13640 | 100.0% | 13.2%(+86.8)#11 | 10.9%(+89.1)#114 |
| 12. | 13103 | 100.0% | 13.2%(+86.8)#12 | 10.9%(+89.1)#130 |
| 13. | 12973 | 100.0% | 13.2%(+86.8)#13 | 10.9%(+89.1)#157 |
| 14. | 12964 | 100.0% | 13.2%(+86.8)#14 | 10.9%(+89.1)#180 |
| 15. | 14035 | 100.0% | 13.2%(+86.8)#15 | 10.9%(+89.1)#191 |
| 16. | 12494 | 99.9% | 13.2%(+86.7)#16 | 10.9%(+89.0)#219 |
| 17. | 10597 | 99.9% | 13.2%(+86.7)#17 | 10.9%(+89.0)#224 |
| 18. | 12924 | 99.9% | 13.2%(+86.7)#18 | 10.9%(+89.0)#236 |
| 19. | 12847 | 92.1% | 13.2%(+78.9)#19 | 10.9%(+81.2)#267 |
| 20. | 14480 | 89.4% | 13.2%(+76.2)#20 | 10.9%(+78.5)#277 |
| 21. | 12923 | 84.8% | 13.2%(+71.6)#21 | 10.9%(+73.9)#295 |
| 22. | 12993 | 81.2% | 13.2%(+68.0)#22 | 10.9%(+70.3)#312 |
| 23. | 13670 | 71.4% | 13.2%(+58.2)#23 | 10.9%(+60.5)#372 |
| 24. | 14126 | 68.4% | 13.2%(+55.2)#24 | 10.9%(+57.5)#402 |
| 25. | 12777 | 67.3% | 13.2%(+54.1)#25 | 10.9%(+56.4)#412 |
| 26. | 12036 | 63.6% | 13.2%(+50.4)#26 | 10.9%(+52.7)#458 |
| 27. | 12592 | 62.6% | 13.2%(+49.4)#27 | 10.9%(+51.7)#468 |
| 28. | 10596 | 62.0% | 13.2%(+48.8)#28 | 10.9%(+51.1)#480 |
| 29. | 12817 | 60.0% | 13.2%(+46.8)#29 | 10.9%(+49.1)#505 |
| 30. | 13634 | 59.9% | 13.2%(+46.7)#30 | 10.9%(+49.0)#510 |
| 31. | 13809 | 59.1% | 13.2%(+45.9)#31 | 10.9%(+48.2)#527 |
| 32. | 11721 | 58.7% | 13.2%(+45.5)#32 | 10.9%(+47.8)#534 |
| 33. | 12747 | 58.2% | 13.2%(+45.0)#33 | 10.9%(+47.3)#543 |
| 34. | 12175 | 56.2% | 13.2%(+43.0)#34 | 10.9%(+45.3)#590 |
| 35. | 13345 | 55.5% | 13.2%(+42.3)#35 | 10.9%(+44.6)#610 |
| 36. | 12768 | 55.2% | 13.2%(+42.0)#36 | 10.9%(+44.3)#619 |
| 37. | 12810 | 53.3% | 13.2%(+40.1)#37 | 10.9%(+42.4)#676 |
| 38. | 13621 | 52.4% | 13.2%(+39.2)#38 | 10.9%(+41.5)#700 |
| 39. | 14769 | 51.4% | 13.2%(+38.2)#39 | 10.9%(+40.5)#723 |
| 40. | 12723 | 51.3% | 13.2%(+38.1)#40 | 10.9%(+40.4)#726 |
| 41. | 13348 | 50.8% | 13.2%(+37.6)#41 | 10.9%(+39.9)#736 |
| 42. | 13744 | 50.0% | 13.2%(+36.8)#42 | 10.9%(+39.1)#748 |
| 43. | 13636 | 50.0% | 13.2%(+36.8)#43 | 10.9%(+39.1)#772 |
| 44. | 14723 | 49.9% | 13.2%(+36.7)#44 | 10.9%(+39.0)#793 |
| 45. | 10527 | 49.9% | 13.2%(+36.7)#45 | 10.9%(+39.0)#796 |
| 46. | 13740 | 49.9% | 13.2%(+36.7)#46 | 10.9%(+39.0)#797 |
| 47. | 12775 | 48.6% | 13.2%(+35.4)#47 | 10.9%(+37.7)#834 |
| 48. | 14025 | 47.0% | 13.2%(+33.8)#48 | 10.9%(+36.1)#883 |
| 49. | 12193 | 46.6% | 13.2%(+33.4)#49 | 10.9%(+35.7)#899 |
| 50. | 14415 | 46.6% | 13.2%(+33.4)#50 | 10.9%(+35.7)#906 |
| 51. | 14069 | 46.1% | 13.2%(+32.9)#51 | 10.9%(+35.2)#919 |
| 52. | 12160 | 45.7% | 13.2%(+32.5)#52 | 10.9%(+34.8)#936 |
| 53. | 13044 | 44.3% | 13.2%(+31.1)#53 | 10.9%(+33.4)#1,001 |
| 54. | 12819 | 43.9% | 13.2%(+30.7)#54 | 10.9%(+33.0)#1,017 |
| 55. | 14143 | 43.1% | 13.2%(+29.9)#55 | 10.9%(+32.2)#1,061 |
| 56. | 12522 | 42.6% | 13.2%(+29.4)#56 | 10.9%(+31.7)#1,095 |
| 57. | 12928 | 42.6% | 13.2%(+29.4)#57 | 10.9%(+31.7)#1,097 |
| 58. | 12077 | 42.5% | 13.2%(+29.3)#58 | 10.9%(+31.6)#1,102 |
| 59. | 14170 | 42.5% | 13.2%(+29.3)#59 | 10.9%(+31.6)#1,107 |
| 60. | 14427 | 42.5% | 13.2%(+29.3)#60 | 10.9%(+31.6)#1,108 |
| 61. | 13782 | 42.5% | 13.2%(+29.3)#61 | 10.9%(+31.6)#1,110 |
| 62. | 12498 | 42.3% | 13.2%(+29.1)#62 | 10.9%(+31.4)#1,124 |
| 63. | 14036 | 42.2% | 13.2%(+29.0)#63 | 10.9%(+31.3)#1,128 |
| 64. | 13490 | 42.0% | 13.2%(+28.8)#64 | 10.9%(+31.1)#1,133 |
| 65. | 10973 | 41.8% | 13.2%(+28.6)#65 | 10.9%(+30.9)#1,141 |
| 66. | 13060 | 41.5% | 13.2%(+28.3)#66 | 10.9%(+30.6)#1,163 |
| 67. | 12069 | 41.4% | 13.2%(+28.2)#67 | 10.9%(+30.5)#1,168 |
| 68. | 12017 | 41.3% | 13.2%(+28.1)#68 | 10.9%(+30.4)#1,176 |
| 69. | 13478 | 40.6% | 13.2%(+27.4)#69 | 10.9%(+29.7)#1,211 |
| 70. | 12903 | 40.3% | 13.2%(+27.1)#70 | 10.9%(+29.4)#1,227 |
| 71. | 11952 | 40.2% | 13.2%(+27.0)#71 | 10.9%(+29.3)#1,233 |
| 72. | 14707 | 40.0% | 13.2%(+26.8)#72 | 10.9%(+29.1)#1,253 |
| 73. | 14877 | 39.6% | 13.2%(+26.4)#73 | 10.9%(+28.7)#1,287 |
| 74. | 14754 | 39.4% | 13.2%(+26.2)#74 | 10.9%(+28.5)#1,293 |
| 75. | 14204 | 39.3% | 13.2%(+26.1)#75 | 10.9%(+28.4)#1,295 |
| 76. | 12913 | 39.2% | 13.2%(+26.0)#76 | 10.9%(+28.3)#1,303 |
| 77. | 11715 | 39.1% | 13.2%(+25.9)#77 | 10.9%(+28.2)#1,307 |
| 78. | 13145 | 39.1% | 13.2%(+25.9)#78 | 10.9%(+28.2)#1,309 |
| 79. | 13454 | 39.1% | 13.2%(+25.9)#79 | 10.9%(+28.2)#1,310 |
| 80. | 12156 | 38.6% | 13.2%(+25.4)#80 | 10.9%(+27.7)#1,355 |
| 81. | 12066 | 38.1% | 13.2%(+24.9)#81 | 10.9%(+27.2)#1,389 |
| 82. | 13757 | 37.5% | 13.2%(+24.3)#82 | 10.9%(+26.6)#1,432 |
| 83. | 13131 | 37.4% | 13.2%(+24.2)#83 | 10.9%(+26.5)#1,447 |
| 84. | 13680 | 37.2% | 13.2%(+24.0)#84 | 10.9%(+26.3)#1,461 |
| 85. | 10532 | 37.1% | 13.2%(+23.9)#85 | 10.9%(+26.2)#1,465 |
| 86. | 10548 | 37.0% | 13.2%(+23.8)#86 | 10.9%(+26.1)#1,468 |
| 87. | 12076 | 36.8% | 13.2%(+23.6)#87 | 10.9%(+25.9)#1,476 |
| 88. | 14167 | 36.4% | 13.2%(+23.2)#88 | 10.9%(+25.5)#1,508 |
| 89. | 13731 | 36.3% | 13.2%(+23.1)#89 | 10.9%(+25.4)#1,518 |
| 90. | 11439 | 35.8% | 13.2%(+22.6)#90 | 10.9%(+24.9)#1,547 |
| 91. | 14818 | 35.7% | 13.2%(+22.5)#91 | 10.9%(+24.8)#1,559 |
| 92. | 13795 | 35.6% | 13.2%(+22.4)#92 | 10.9%(+24.7)#1,570 |
| 93. | 13681 | 35.4% | 13.2%(+22.2)#93 | 10.9%(+24.5)#1,584 |
| 94. | 11433 | 35.1% | 13.2%(+21.9)#94 | 10.9%(+24.2)#1,603 |
| 95. | 14472 | 34.9% | 13.2%(+21.7)#95 | 10.9%(+24.0)#1,619 |
| 96. | 12461 | 34.5% | 13.2%(+21.3)#96 | 10.9%(+23.6)#1,655 |
| 97. | 14560 | 34.3% | 13.2%(+21.1)#97 | 10.9%(+23.4)#1,670 |
| 98. | 14823 | 33.6% | 13.2%(+20.4)#98 | 10.9%(+22.7)#1,725 |
| 99. | 10040 | 33.3% | 13.2%(+20.1)#99 | 10.9%(+22.4)#1,736 |
| 100. | 10588 | 33.3% | 13.2%(+20.1)#100 | 10.9%(+22.4)#1,743 |
Common Questions
What are the Top 10 Zip Codes with the Highest Unemployment Rate Amomg Youth Under the Age of 25 in New York?
Top 10 Zip Codes with the Highest Unemployment Rate Amomg Youth Under the Age of 25 in New York are:
What zip code has the Highest Unemployment Rate Amomg Youth Under the Age of 25 in New York?
13313 has the Highest Unemployment Rate Amomg Youth Under the Age of 25 in New York with 100.0%.
What is the Unemployment Rate Amomg Youth Under the Age of 25 in the State of New York?
Unemployment Rate Amomg Youth Under the Age of 25 in New York is 13.2%.
What is the Unemployment Rate Amomg Youth Under the Age of 25 in the United States?
Unemployment Rate Amomg Youth Under the Age of 25 in the United States is 10.9%.