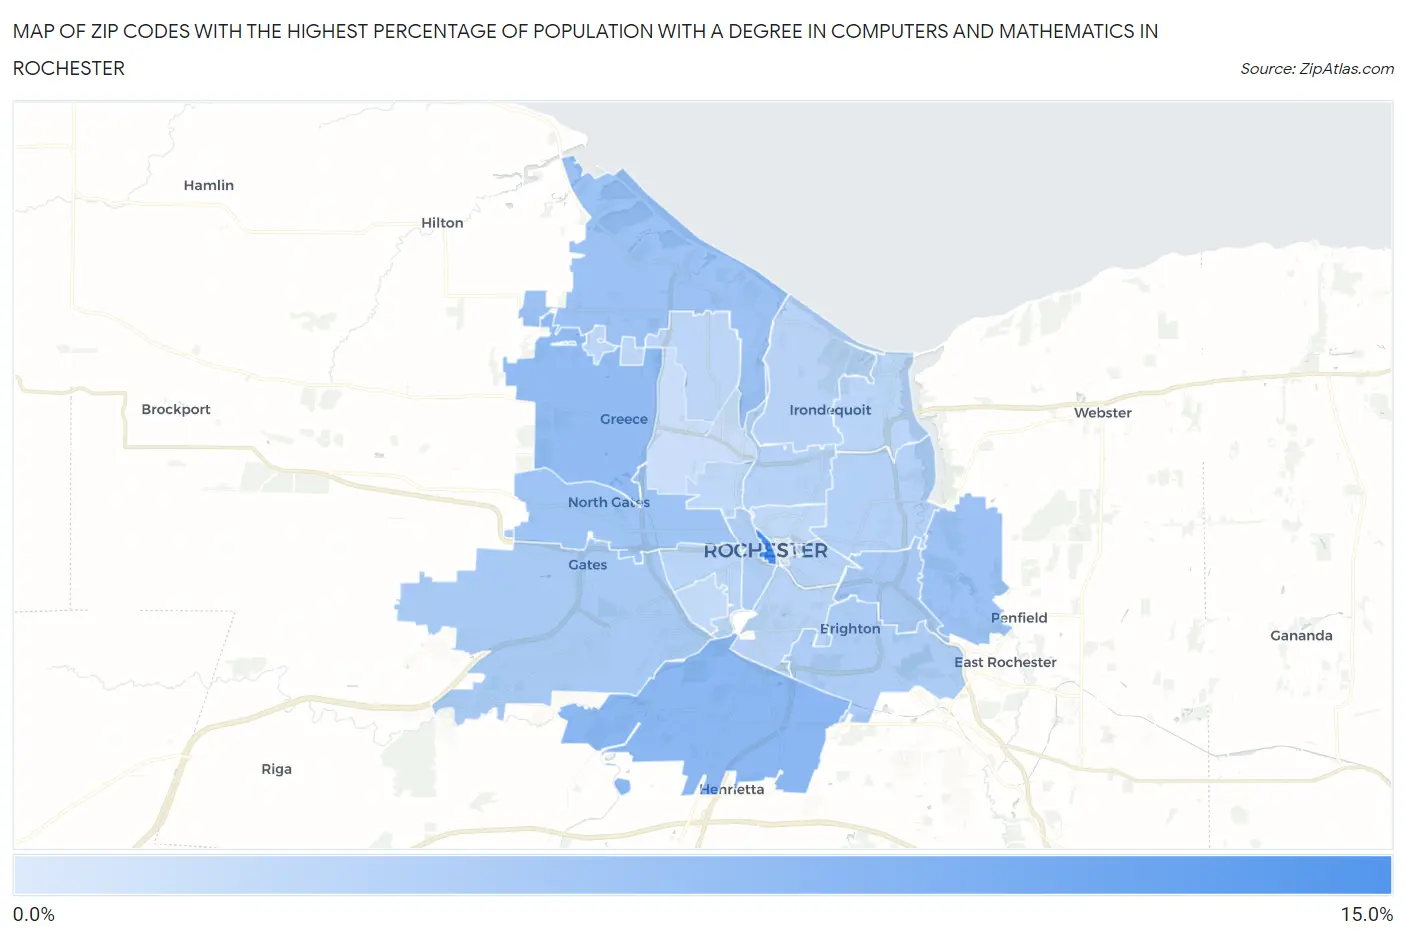
Zip Codes with the Highest Percentage of Population with a Degree in Computers and Mathematics in Rochester, NY
RELATED REPORTS & OPTIONS
Computers and Mathematics
Rochester
Compare Zip Codes
Map of Zip Codes with the Highest Percentage of Population with a Degree in Computers and Mathematics in Rochester
0.0%
15.0%
Zip Codes with the Highest Percentage of Population with a Degree in Computers and Mathematics in Rochester, NY
| Zip Code | % Graduates | vs State | vs National | |
| 1. | 14614 | 14.8% | 4.7%(+10.1)#34 | 4.9%(+9.95)#803 |
| 2. | 14623 | 8.1% | 4.7%(+3.35)#159 | 4.9%(+3.17)#2,847 |
| 3. | 14626 | 7.4% | 4.7%(+2.69)#199 | 4.9%(+2.52)#3,416 |
| 4. | 14625 | 6.6% | 4.7%(+1.90)#269 | 4.9%(+1.73)#4,309 |
| 5. | 14612 | 6.6% | 4.7%(+1.86)#273 | 4.9%(+1.68)#4,352 |
| 6. | 14606 | 6.1% | 4.7%(+1.39)#328 | 4.9%(+1.22)#5,097 |
| 7. | 14610 | 5.6% | 4.7%(+0.857)#393 | 4.9%(+0.686)#6,114 |
| 8. | 14624 | 5.4% | 4.7%(+0.630)#423 | 4.9%(+0.459)#6,633 |
| 9. | 14618 | 4.8% | 4.7%(+0.084)#524 | 4.9%(-0.087)#7,963 |
| 10. | 14608 | 4.6% | 4.7%(-0.080)#560 | 4.9%(-0.250)#8,449 |
| 11. | 14609 | 4.1% | 4.7%(-0.596)#669 | 4.9%(-0.767)#10,063 |
| 12. | 14621 | 4.1% | 4.7%(-0.633)#684 | 4.9%(-0.803)#10,168 |
| 13. | 14607 | 4.0% | 4.7%(-0.734)#703 | 4.9%(-0.905)#10,497 |
| 14. | 14617 | 3.8% | 4.7%(-0.881)#739 | 4.9%(-1.05)#11,038 |
| 15. | 14620 | 3.7% | 4.7%(-1.03)#776 | 4.9%(-1.20)#11,564 |
| 16. | 14622 | 3.5% | 4.7%(-1.23)#833 | 4.9%(-1.40)#12,300 |
| 17. | 14611 | 3.5% | 4.7%(-1.26)#840 | 4.9%(-1.43)#12,415 |
| 18. | 14616 | 3.4% | 4.7%(-1.30)#846 | 4.9%(-1.47)#12,568 |
| 19. | 14605 | 3.2% | 4.7%(-1.55)#908 | 4.9%(-1.72)#13,468 |
| 20. | 14613 | 3.1% | 4.7%(-1.59)#915 | 4.9%(-1.76)#13,613 |
| 21. | 14619 | 2.8% | 4.7%(-1.91)#981 | 4.9%(-2.08)#14,753 |
| 22. | 14615 | 2.0% | 4.7%(-2.71)#1,122 | 4.9%(-2.88)#17,596 |
| 23. | 14604 | 0.41% | 4.7%(-4.32)#1,301 | 4.9%(-4.49)#21,604 |
1
Common Questions
What are the Top 10 Zip Codes with the Highest Percentage of Population with a Degree in Computers and Mathematics in Rochester, NY?
Top 10 Zip Codes with the Highest Percentage of Population with a Degree in Computers and Mathematics in Rochester, NY are:
What zip code has the Highest Percentage of Population with a Degree in Computers and Mathematics in Rochester, NY?
14614 has the Highest Percentage of Population with a Degree in Computers and Mathematics in Rochester, NY with 14.8%.
What is the Percentage of Population with a Degree in Computers and Mathematics in Rochester, NY?
Percentage of Population with a Degree in Computers and Mathematics in Rochester is 3.9%.
What is the Percentage of Population with a Degree in Computers and Mathematics in New York?
Percentage of Population with a Degree in Computers and Mathematics in New York is 4.7%.
What is the Percentage of Population with a Degree in Computers and Mathematics in the United States?
Percentage of Population with a Degree in Computers and Mathematics in the United States is 4.9%.