Zip Codes with the Most Immigrants from Russia in Plattsburgh, NY
RELATED REPORTS & OPTIONS
Russia
Plattsburgh
Compare Zip Codes
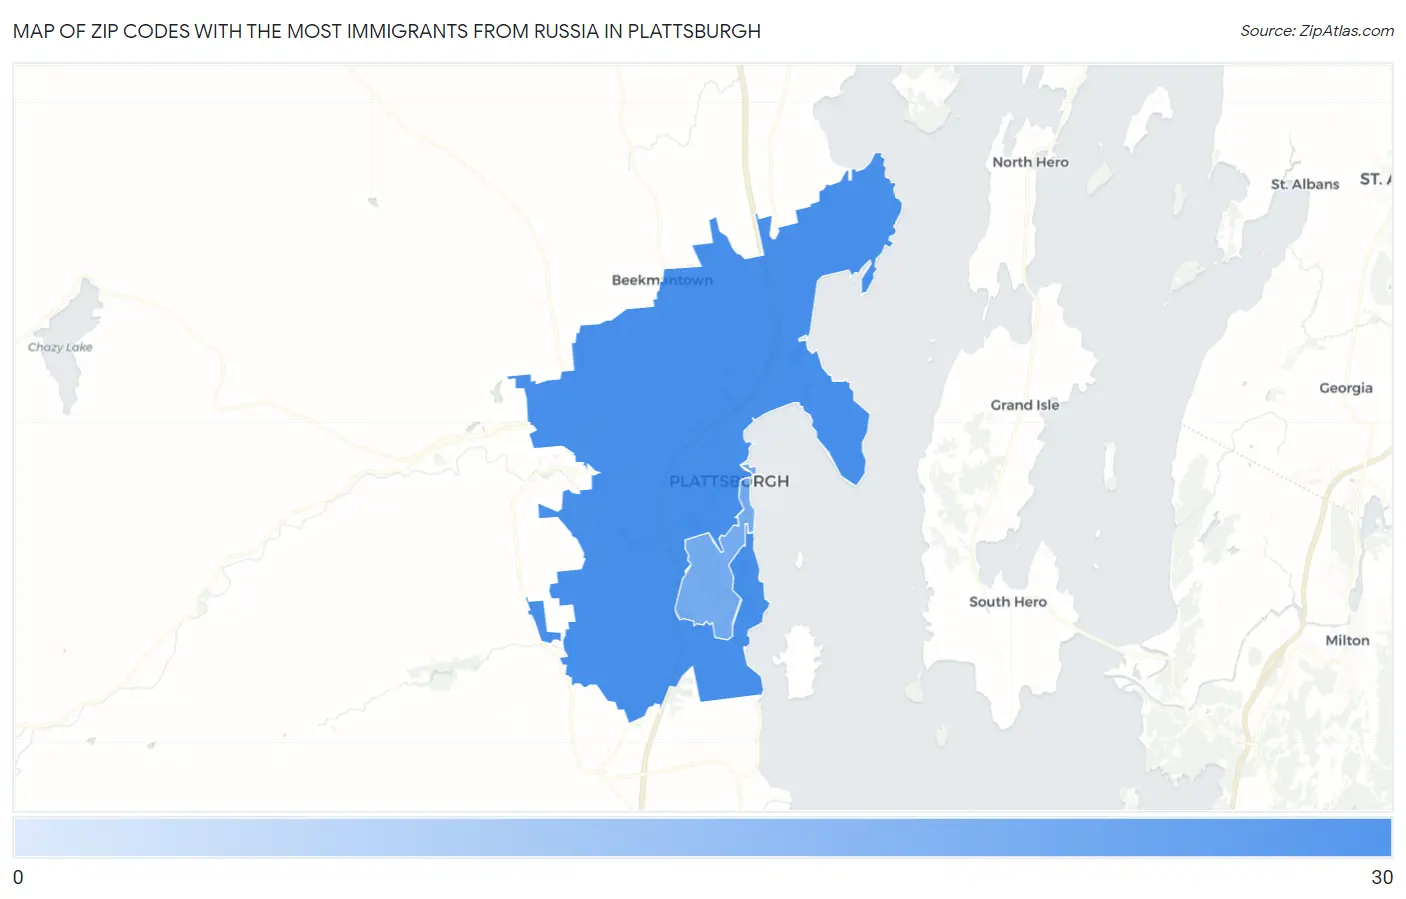
Map of Zip Codes with the Most Immigrants from Russia in Plattsburgh
0
30
Zip Codes with the Most Immigrants from Russia in Plattsburgh, NY
| Zip Code | Russia | vs State | vs National | |
| 1. | 12901 | 27 | 75,802(0.04%)#308 | 406,732(0.01%)#3,240 |
| 2. | 12903 | 9 | 75,802(0.01%)#473 | 406,732(0.00%)#5,456 |
1
Common Questions
What are the Top Zip Codes with the Most Immigrants from Russia in Plattsburgh, NY?
Top Zip Codes with the Most Immigrants from Russia in Plattsburgh, NY are:
What zip code has the Most Immigrants from Russia in Plattsburgh, NY?
12901 has the Most Immigrants from Russia in Plattsburgh, NY with 27.
What is the Total Immigrants from Russia in Plattsburgh, NY?
Total Immigrants from Russia in Plattsburgh is 23.
What is the Total Immigrants from Russia in New York?
Total Immigrants from Russia in New York is 75,802.
What is the Total Immigrants from Russia in the United States?
Total Immigrants from Russia in the United States is 406,732.