Zip Codes with the Highest Percentage of Households with Income Above $100,000 in Plattsburgh, NY
RELATED REPORTS & OPTIONS
Household Income | $100k+
Plattsburgh
Compare Zip Codes
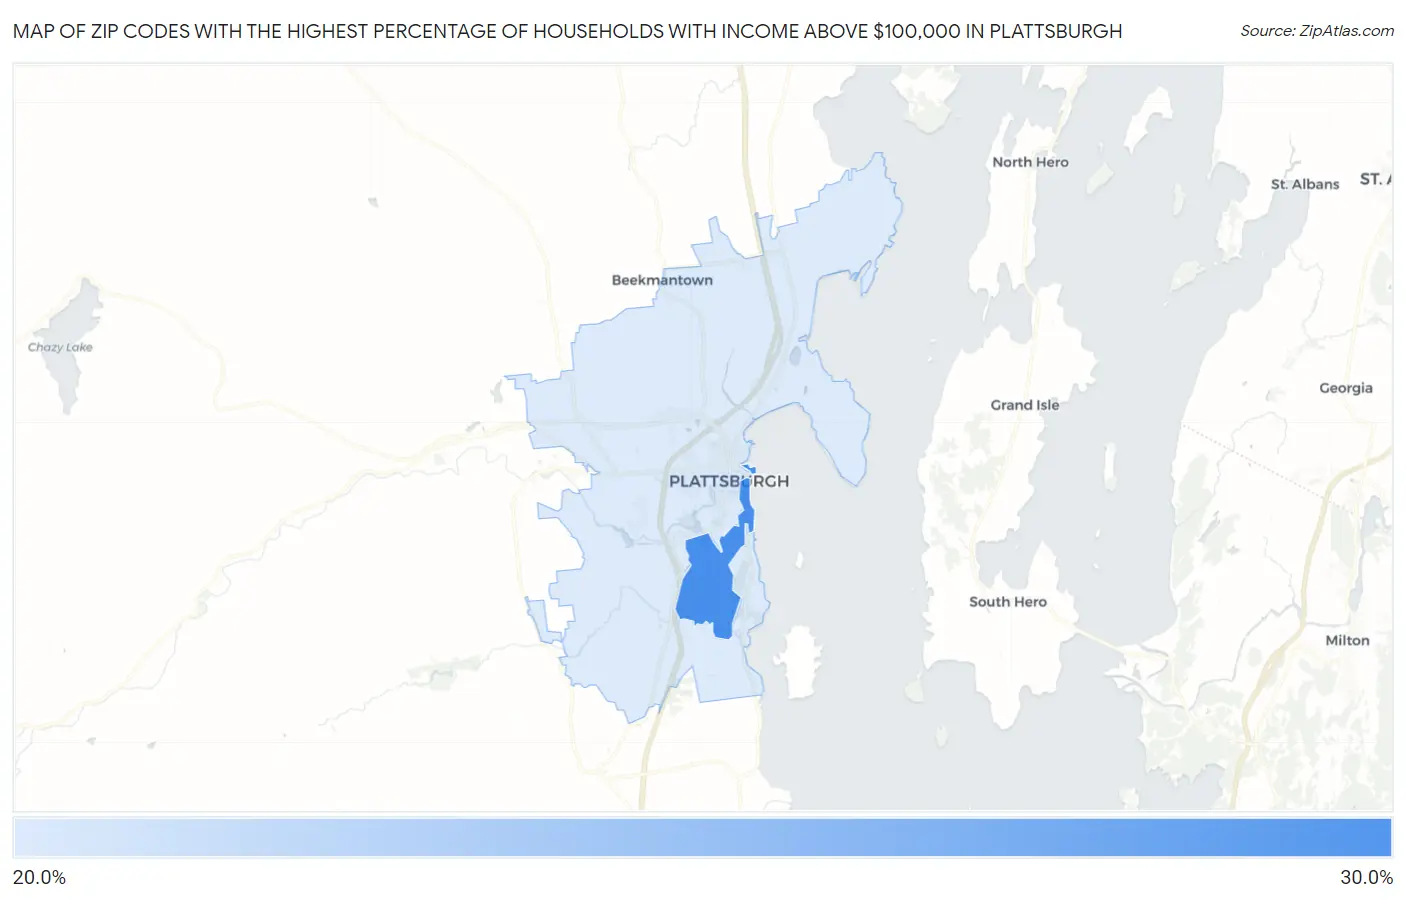
Map of Zip Codes with the Highest Percentage of Households with Income Above $100,000 in Plattsburgh
0.0%
30.0%
Zip Codes with the Highest Percentage of Households with Income Above $100,000 in Plattsburgh, NY
| Zip Code | Households with Income > $100k | vs State | vs National | |
| 1. | 12903 | 29.0% | 41.7%(-12.7)#1,152 | 37.3%(-8.30)#16,265 |
| 2. | 12901 | 28.1% | 41.7%(-13.6)#1,195 | 37.3%(-9.20)#17,024 |
1
Common Questions
What are the Top Zip Codes with the Highest Percentage of Households with Income Above $100,000 in Plattsburgh, NY?
Top Zip Codes with the Highest Percentage of Households with Income Above $100,000 in Plattsburgh, NY are:
What zip code has the Highest Percentage of Households with Income Above $100,000 in Plattsburgh, NY?
12903 has the Highest Percentage of Households with Income Above $100,000 in Plattsburgh, NY with 29.0%.
What is the Percentage of Households with Income Above $100,000 in Plattsburgh, NY?
Percentage of Households with Income Above $100,000 in Plattsburgh is 23.7%.
What is the Percentage of Households with Income Above $100,000 in New York?
Percentage of Households with Income Above $100,000 in New York is 41.7%.
What is the Percentage of Households with Income Above $100,000 in the United States?
Percentage of Households with Income Above $100,000 in the United States is 37.3%.