Zip Codes with the Highest Percentage of Population Employed in Food Preparation & Serving in Lyon Mountain, NY
RELATED REPORTS & OPTIONS
Food Preparation & Serving
Lyon Mountain
Compare Zip Codes
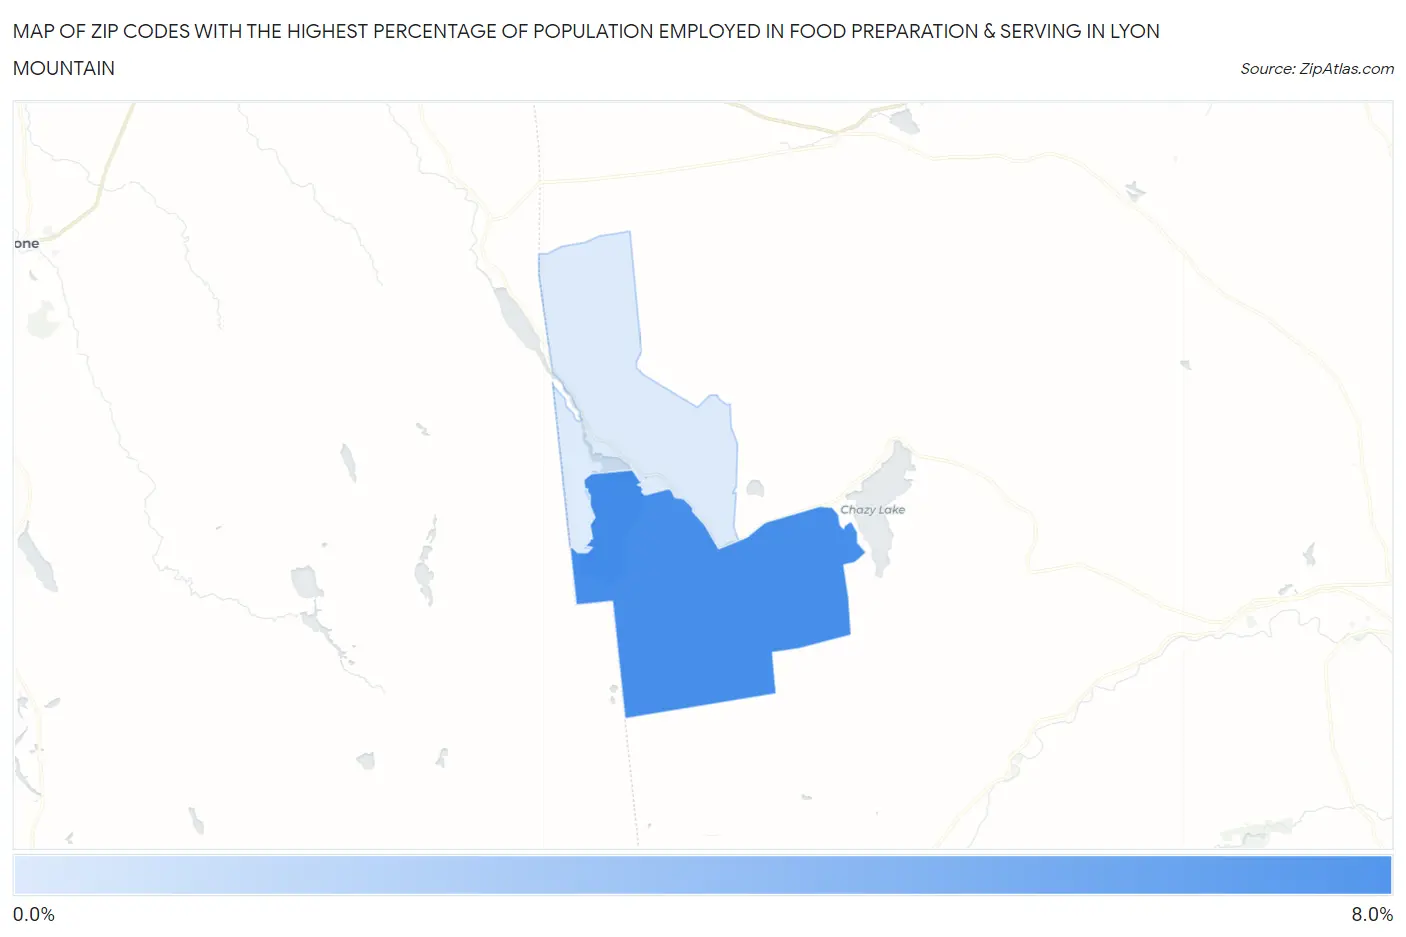
Map of Zip Codes with the Highest Percentage of Population Employed in Food Preparation & Serving in Lyon Mountain
0.0%
8.0%
Zip Codes with the Highest Percentage of Population Employed in Food Preparation & Serving in Lyon Mountain, NY
| Zip Code | % Employed | vs State | vs National | |
| 1. | 12952 | 6.4% | 4.8%(+1.59)#400 | 5.3%(+1.12)#8,125 |
| 2. | 12955 | 0.57% | 4.8%(-4.24)#1,495 | 5.3%(-4.71)#27,606 |
1
Common Questions
What are the Top Zip Codes with the Highest Percentage of Population Employed in Food Preparation & Serving in Lyon Mountain, NY?
Top Zip Codes with the Highest Percentage of Population Employed in Food Preparation & Serving in Lyon Mountain, NY are:
What zip code has the Highest Percentage of Population Employed in Food Preparation & Serving in Lyon Mountain, NY?
12952 has the Highest Percentage of Population Employed in Food Preparation & Serving in Lyon Mountain, NY with 6.4%.
What is the Percentage of Population Employed in Food Preparation & Serving in Lyon Mountain, NY?
Percentage of Population Employed in Food Preparation & Serving in Lyon Mountain is 7.1%.
What is the Percentage of Population Employed in Food Preparation & Serving in New York?
Percentage of Population Employed in Food Preparation & Serving in New York is 4.8%.
What is the Percentage of Population Employed in Food Preparation & Serving in the United States?
Percentage of Population Employed in Food Preparation & Serving in the United States is 5.3%.