Zip Codes with the Highest Percentage of Population with a Degree in Liberal Arts and History in Sparks, NV
RELATED REPORTS & OPTIONS
Liberal Arts and History
Sparks
Compare Zip Codes
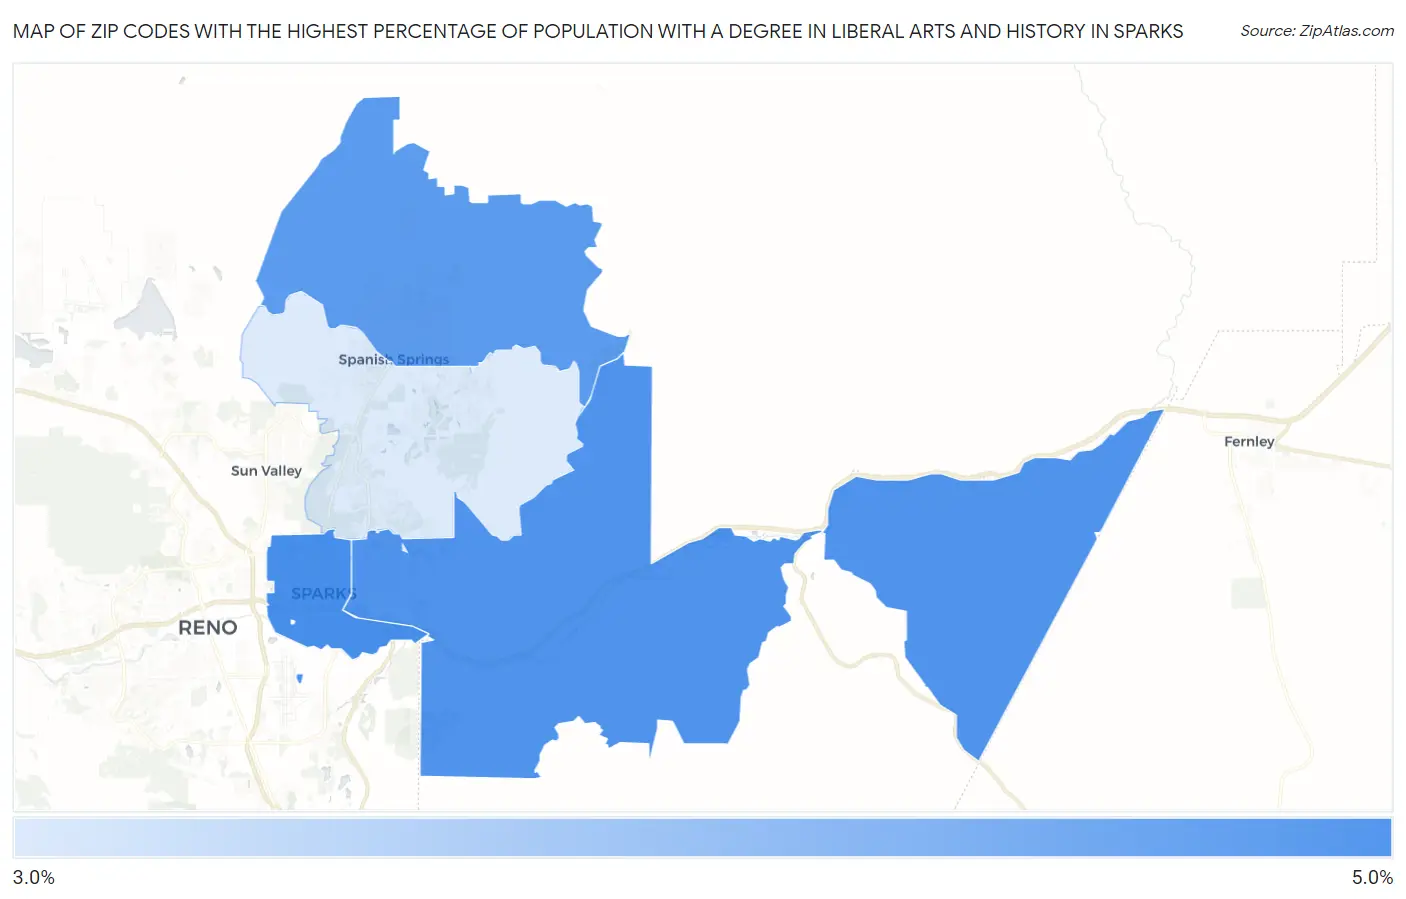
Map of Zip Codes with the Highest Percentage of Population with a Degree in Liberal Arts and History in Sparks
0.0%
5.0%
Zip Codes with the Highest Percentage of Population with a Degree in Liberal Arts and History in Sparks, NV
| Zip Code | % Graduates | vs State | vs National | |
| 1. | 89431 | 4.7% | 3.8%(+0.877)#44 | 4.9%(-0.147)#12,238 |
| 2. | 89434 | 4.7% | 3.8%(+0.814)#49 | 4.9%(-0.210)#12,451 |
| 3. | 89441 | 4.6% | 3.8%(+0.708)#52 | 4.9%(-0.316)#12,774 |
| 4. | 89436 | 3.3% | 3.8%(-0.551)#84 | 4.9%(-1.57)#17,325 |
1
Common Questions
What are the Top 3 Zip Codes with the Highest Percentage of Population with a Degree in Liberal Arts and History in Sparks, NV?
Top 3 Zip Codes with the Highest Percentage of Population with a Degree in Liberal Arts and History in Sparks, NV are:
What zip code has the Highest Percentage of Population with a Degree in Liberal Arts and History in Sparks, NV?
89431 has the Highest Percentage of Population with a Degree in Liberal Arts and History in Sparks, NV with 4.7%.
What is the Percentage of Population with a Degree in Liberal Arts and History in Sparks, NV?
Percentage of Population with a Degree in Liberal Arts and History in Sparks is 4.0%.
What is the Percentage of Population with a Degree in Liberal Arts and History in Nevada?
Percentage of Population with a Degree in Liberal Arts and History in Nevada is 3.8%.
What is the Percentage of Population with a Degree in Liberal Arts and History in the United States?
Percentage of Population with a Degree in Liberal Arts and History in the United States is 4.9%.