Zip Codes with the Highest Percentage of Population with a Degree in Liberal Arts and History in Carson City, NV
RELATED REPORTS & OPTIONS
Liberal Arts and History
Carson City
Compare Zip Codes
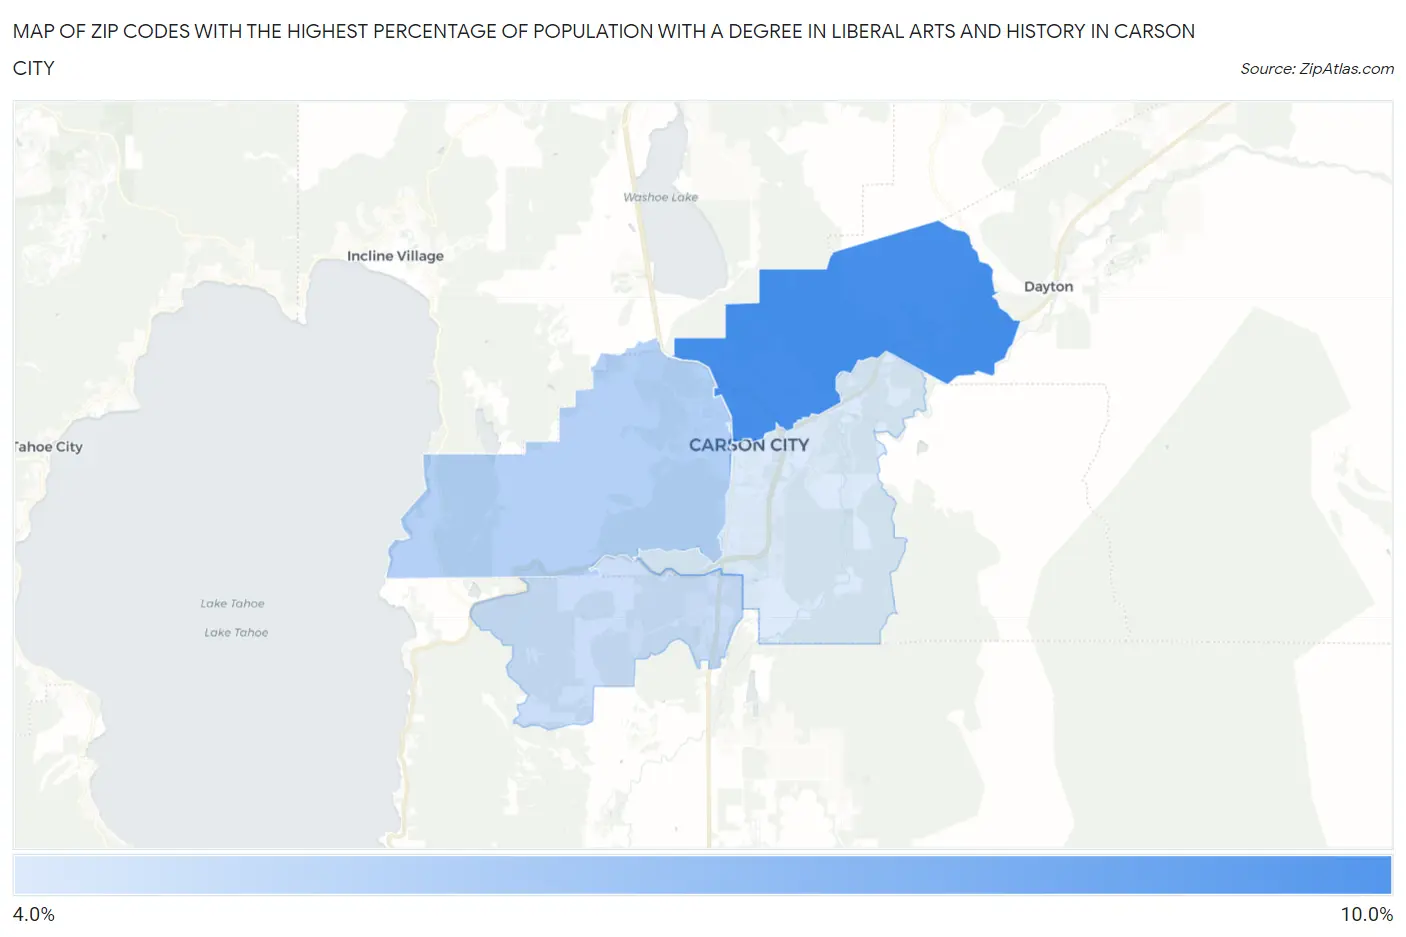
Map of Zip Codes with the Highest Percentage of Population with a Degree in Liberal Arts and History in Carson City
0.0%
10.0%
Zip Codes with the Highest Percentage of Population with a Degree in Liberal Arts and History in Carson City, NV
| Zip Code | % Graduates | vs State | vs National | |
| 1. | 89706 | 9.3% | 3.8%(+5.47)#11 | 4.9%(+4.45)#3,585 |
| 2. | 89703 | 5.5% | 3.8%(+1.63)#30 | 4.9%(+0.605)#9,929 |
| 3. | 89705 | 4.7% | 3.8%(+0.827)#48 | 4.9%(-0.197)#12,411 |
| 4. | 89701 | 4.0% | 3.8%(+0.166)#69 | 4.9%(-0.858)#14,722 |
1
Common Questions
What are the Top 3 Zip Codes with the Highest Percentage of Population with a Degree in Liberal Arts and History in Carson City, NV?
Top 3 Zip Codes with the Highest Percentage of Population with a Degree in Liberal Arts and History in Carson City, NV are:
What zip code has the Highest Percentage of Population with a Degree in Liberal Arts and History in Carson City, NV?
89706 has the Highest Percentage of Population with a Degree in Liberal Arts and History in Carson City, NV with 9.3%.
What is the Percentage of Population with a Degree in Liberal Arts and History in Nevada?
Percentage of Population with a Degree in Liberal Arts and History in Nevada is 3.8%.
What is the Percentage of Population with a Degree in Liberal Arts and History in the United States?
Percentage of Population with a Degree in Liberal Arts and History in the United States is 4.9%.