Zip Codes with the Highest Percentage of Population Employed in Food Preparation & Serving in Reno, NV
RELATED REPORTS & OPTIONS
Food Preparation & Serving
Reno
Compare Zip Codes
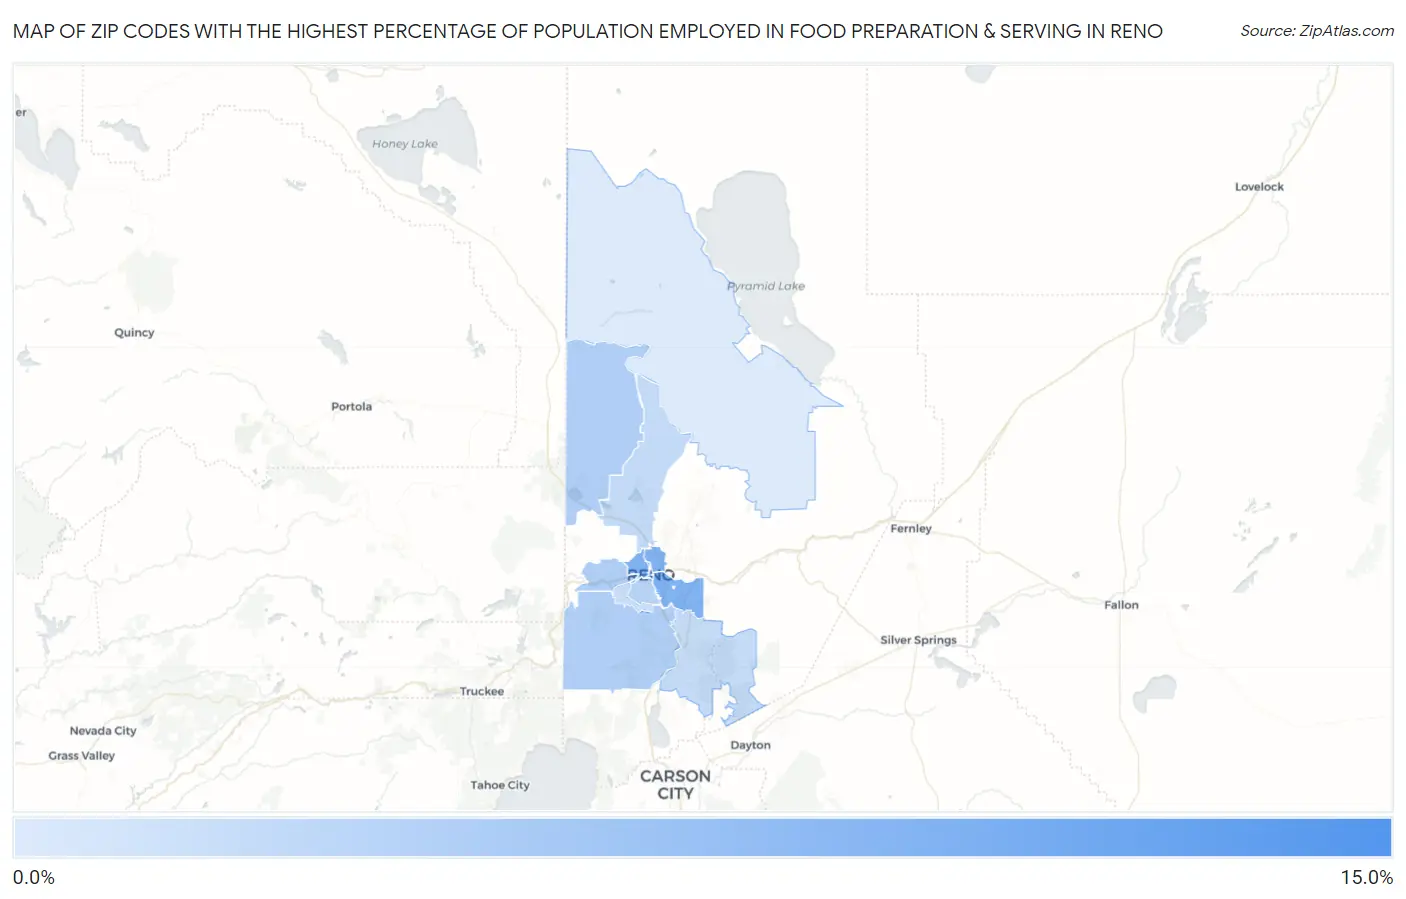
Map of Zip Codes with the Highest Percentage of Population Employed in Food Preparation & Serving in Reno
0.0%
15.0%
Zip Codes with the Highest Percentage of Population Employed in Food Preparation & Serving in Reno, NV
| Zip Code | % Employed | vs State | vs National | |
| 1. | 89557 | 14.9% | 8.6%(+6.24)#14 | 5.3%(+9.60)#1,000 |
| 2. | 89502 | 9.5% | 8.6%(+0.817)#45 | 5.3%(+4.17)#3,092 |
| 3. | 89512 | 9.3% | 8.6%(+0.702)#48 | 5.3%(+4.06)#3,194 |
| 4. | 89503 | 9.3% | 8.6%(+0.622)#49 | 5.3%(+3.98)#3,268 |
| 5. | 89501 | 7.4% | 8.6%(-1.22)#74 | 5.3%(+2.13)#5,708 |
| 6. | 89511 | 5.2% | 8.6%(-3.44)#91 | 5.3%(-0.087)#12,146 |
| 7. | 89523 | 5.1% | 8.6%(-3.57)#92 | 5.3%(-0.214)#12,645 |
| 8. | 89508 | 5.1% | 8.6%(-3.58)#93 | 5.3%(-0.224)#12,682 |
| 9. | 89509 | 4.4% | 8.6%(-4.24)#103 | 5.3%(-0.881)#15,397 |
| 10. | 89506 | 3.5% | 8.6%(-5.12)#117 | 5.3%(-1.77)#19,120 |
| 11. | 89521 | 3.3% | 8.6%(-5.29)#120 | 5.3%(-1.94)#19,828 |
| 12. | 89519 | 2.8% | 8.6%(-5.80)#125 | 5.3%(-2.44)#21,878 |
| 13. | 89510 | 1.4% | 8.6%(-7.26)#135 | 5.3%(-3.90)#26,244 |
1
Common Questions
What are the Top 10 Zip Codes with the Highest Percentage of Population Employed in Food Preparation & Serving in Reno, NV?
Top 10 Zip Codes with the Highest Percentage of Population Employed in Food Preparation & Serving in Reno, NV are:
What zip code has the Highest Percentage of Population Employed in Food Preparation & Serving in Reno, NV?
89557 has the Highest Percentage of Population Employed in Food Preparation & Serving in Reno, NV with 14.9%.
What is the Percentage of Population Employed in Food Preparation & Serving in Reno, NV?
Percentage of Population Employed in Food Preparation & Serving in Reno is 6.5%.
What is the Percentage of Population Employed in Food Preparation & Serving in Nevada?
Percentage of Population Employed in Food Preparation & Serving in Nevada is 8.6%.
What is the Percentage of Population Employed in Food Preparation & Serving in the United States?
Percentage of Population Employed in Food Preparation & Serving in the United States is 5.3%.