Zip Codes with the Highest Percentage of Population Employed in Health Diagnosing & Treating in Gallup, NM
RELATED REPORTS & OPTIONS
Health Diagnosing & Treating
Gallup
Compare Zip Codes
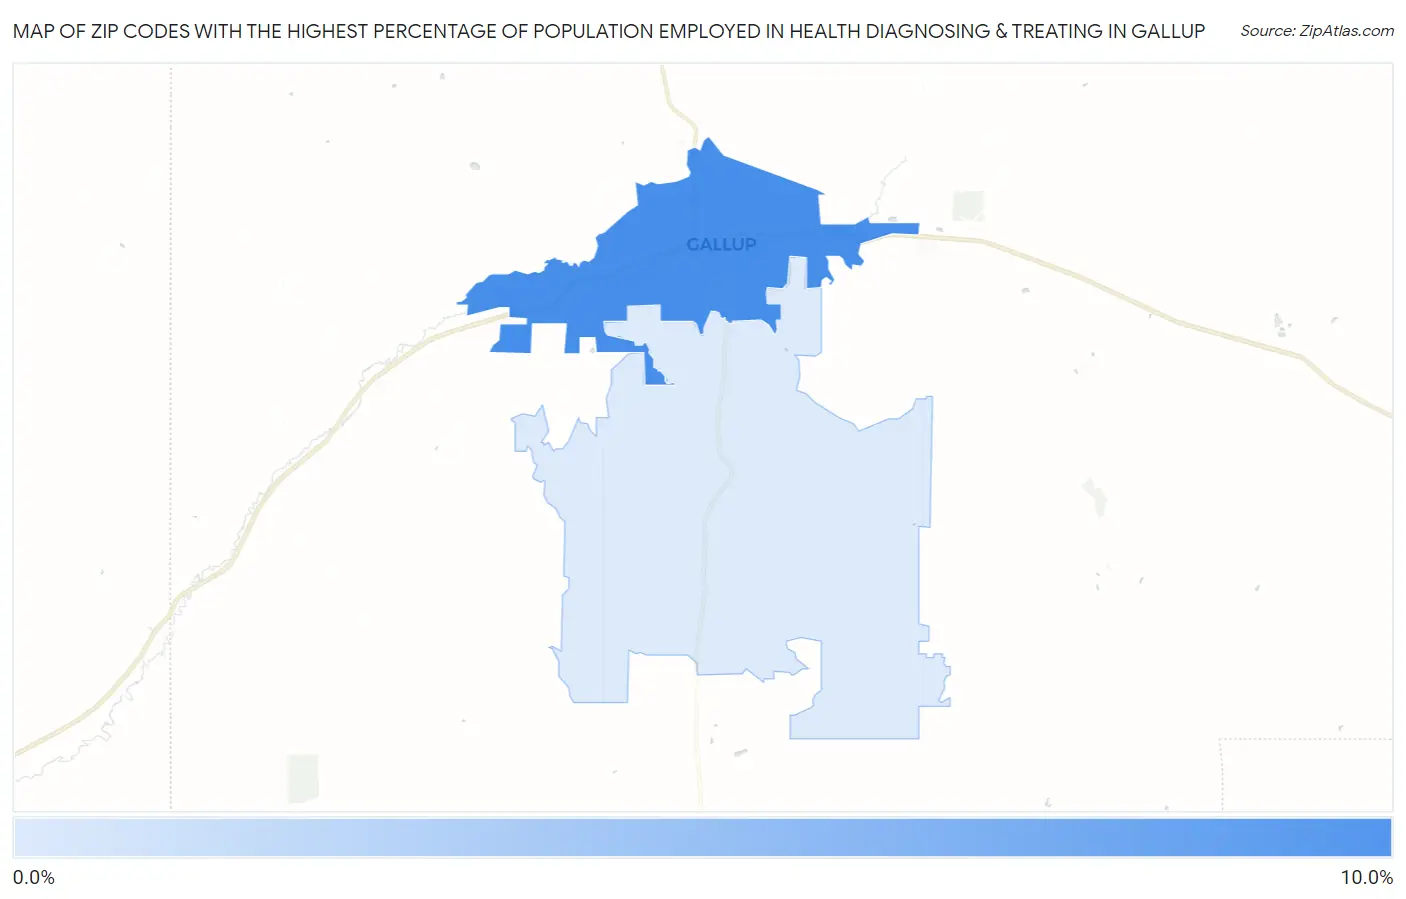
Map of Zip Codes with the Highest Percentage of Population Employed in Health Diagnosing & Treating in Gallup
0.0%
10.0%
Zip Codes with the Highest Percentage of Population Employed in Health Diagnosing & Treating in Gallup, NM
| Zip Code | % Employed | vs State | vs National | |
| 1. | 87301 | 8.7% | 5.9%(+2.78)#45 | 6.2%(+2.48)#5,897 |
| 2. | 87305 | 1.9% | 5.9%(-4.08)#181 | 6.2%(-4.39)#26,707 |
1
Common Questions
What are the Top Zip Codes with the Highest Percentage of Population Employed in Health Diagnosing & Treating in Gallup, NM?
Top Zip Codes with the Highest Percentage of Population Employed in Health Diagnosing & Treating in Gallup, NM are:
What zip code has the Highest Percentage of Population Employed in Health Diagnosing & Treating in Gallup, NM?
87301 has the Highest Percentage of Population Employed in Health Diagnosing & Treating in Gallup, NM with 8.7%.
What is the Percentage of Population Employed in Health Diagnosing & Treating in Gallup, NM?
Percentage of Population Employed in Health Diagnosing & Treating in Gallup is 8.7%.
What is the Percentage of Population Employed in Health Diagnosing & Treating in New Mexico?
Percentage of Population Employed in Health Diagnosing & Treating in New Mexico is 5.9%.
What is the Percentage of Population Employed in Health Diagnosing & Treating in the United States?
Percentage of Population Employed in Health Diagnosing & Treating in the United States is 6.2%.