Zip Codes with the Highest Percentage of Immigrants from Latin America in Omaha, NE
RELATED REPORTS & OPTIONS
Latin America
Omaha
Compare Zip Codes
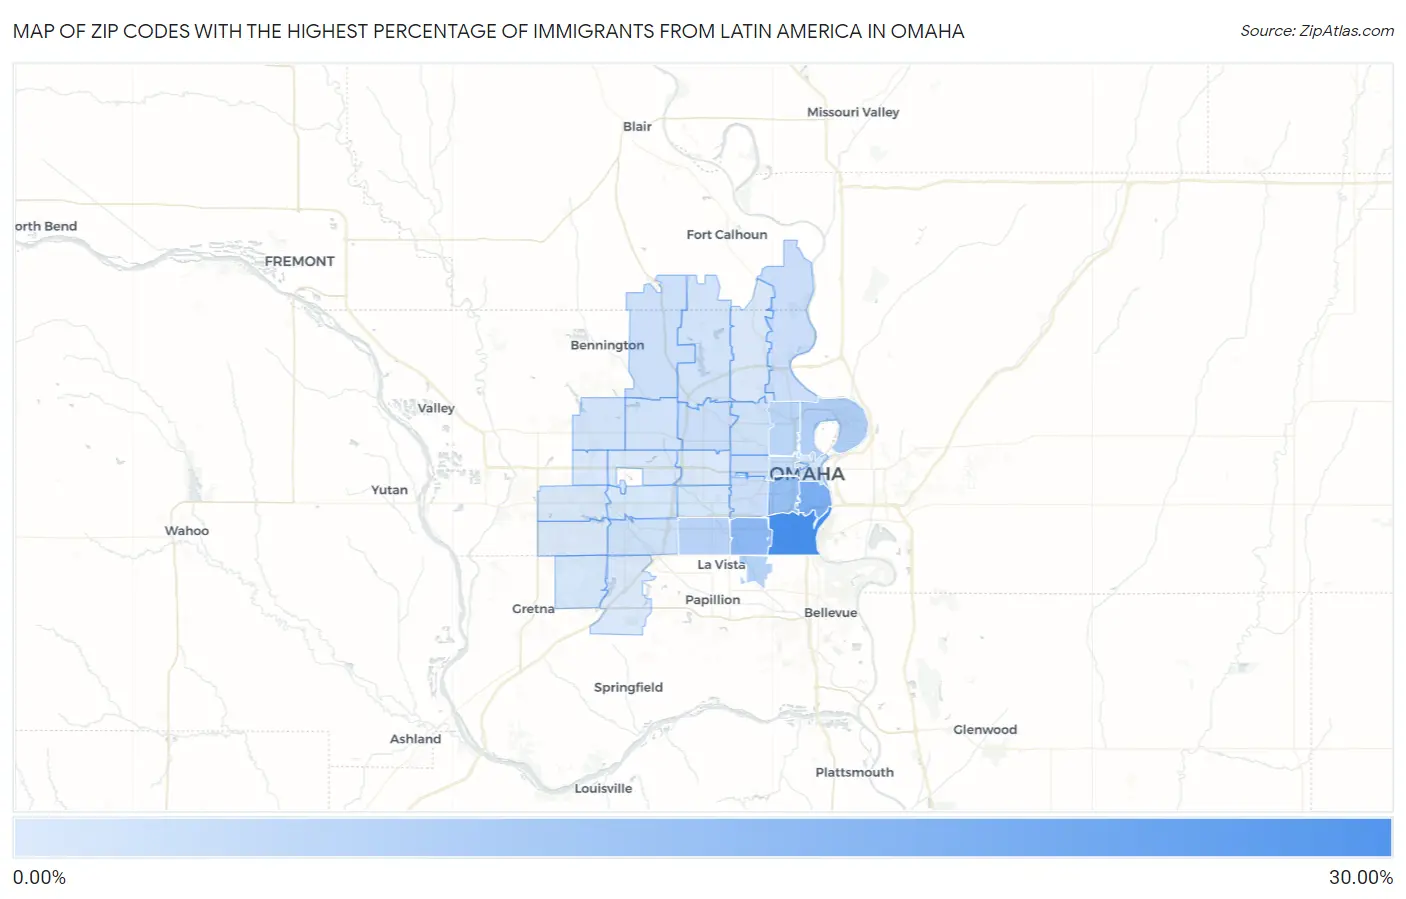
Map of Zip Codes with the Highest Percentage of Immigrants from Latin America in Omaha
0.00%
30.00%
Zip Codes with the Highest Percentage of Immigrants from Latin America in Omaha, NE
| Zip Code | Latin America | vs State | vs National | |
| 1. | 68107 | 28.15% | 3.92%(+24.2)#-1 | 6.84%(+21.3)#0 |
| 2. | 68108 | 17.87% | 3.92%(+14.0)#0 | 6.84%(+11.0)#1 |
| 3. | 68117 | 14.08% | 3.92%(+10.2)#1 | 6.84%(+7.24)#2 |
| 4. | 68105 | 12.47% | 3.92%(+8.55)#2 | 6.84%(+5.63)#3 |
| 5. | 68110 | 7.79% | 3.92%(+3.87)#14 | 6.84%(+0.948)#2,454 |
| 6. | 68157 | 6.56% | 3.92%(+2.64)#15 | 6.84%(-0.280)#2,455 |
| 7. | 68127 | 6.45% | 3.92%(+2.53)#16 | 6.84%(-0.395)#2,456 |
| 8. | 68111 | 5.84% | 3.92%(+1.93)#17 | 6.84%(-0.998)#2,457 |
| 9. | 68131 | 4.38% | 3.92%(+0.458)#18 | 6.84%(-2.47)#2,458 |
| 10. | 68106 | 3.03% | 3.92%(-0.889)#24 | 6.84%(-3.81)#4,191 |
| 11. | 68134 | 3.01% | 3.92%(-0.912)#28 | 6.84%(-3.84)#4,391 |
| 12. | 68112 | 2.98% | 3.92%(-0.933)#29 | 6.84%(-3.86)#4,392 |
| 13. | 68142 | 2.67% | 3.92%(-1.25)#30 | 6.84%(-4.17)#4,393 |
| 14. | 68132 | 2.61% | 3.92%(-1.31)#31 | 6.84%(-4.23)#4,394 |
| 15. | 68137 | 2.35% | 3.92%(-1.57)#32 | 6.84%(-4.49)#4,395 |
| 16. | 68104 | 2.12% | 3.92%(-1.79)#33 | 6.84%(-4.72)#4,396 |
| 17. | 68164 | 2.02% | 3.92%(-1.89)#34 | 6.84%(-4.82)#4,397 |
| 18. | 68122 | 1.87% | 3.92%(-2.05)#35 | 6.84%(-4.97)#4,398 |
| 19. | 68116 | 1.82% | 3.92%(-2.10)#36 | 6.84%(-5.02)#4,399 |
| 20. | 68102 | 1.55% | 3.92%(-2.37)#37 | 6.84%(-5.29)#4,400 |
| 21. | 68178 | 1.48% | 3.92%(-2.44)#38 | 6.84%(-5.36)#4,401 |
| 22. | 68144 | 1.22% | 3.92%(-2.70)#39 | 6.84%(-5.62)#4,819 |
| 23. | 68182 | 1.19% | 3.92%(-2.73)#40 | 6.84%(-5.65)#4,820 |
| 24. | 68124 | 1.18% | 3.92%(-2.74)#41 | 6.84%(-5.66)#4,821 |
| 25. | 68136 | 1.14% | 3.92%(-2.78)#42 | 6.84%(-5.70)#4,822 |
| 26. | 68130 | 0.75% | 3.92%(-3.17)#43 | 6.84%(-6.09)#4,823 |
| 27. | 68152 | 0.70% | 3.92%(-3.22)#44 | 6.84%(-6.14)#4,824 |
| 28. | 68154 | 0.65% | 3.92%(-3.27)#45 | 6.84%(-6.19)#4,825 |
| 29. | 68118 | 0.47% | 3.92%(-3.45)#46 | 6.84%(-6.37)#4,826 |
| 30. | 68138 | 0.43% | 3.92%(-3.49)#47 | 6.84%(-6.41)#4,827 |
| 31. | 68135 | 0.34% | 3.92%(-3.58)#48 | 6.84%(-6.50)#4,828 |
| 32. | 68114 | 0.31% | 3.92%(-3.60)#49 | 6.84%(-6.53)#4,829 |
1
Common Questions
What are the Top 10 Zip Codes with the Highest Percentage of Immigrants from Latin America in Omaha, NE?
Top 10 Zip Codes with the Highest Percentage of Immigrants from Latin America in Omaha, NE are:
What zip code has the Highest Percentage of Immigrants from Latin America in Omaha, NE?
68107 has the Highest Percentage of Immigrants from Latin America in Omaha, NE with 28.15%.
What is the Percentage of Immigrants from Latin America in Omaha, NE?
Percentage of Immigrants from Latin America in Omaha is 5.04%.
What is the Percentage of Immigrants from Latin America in Nebraska?
Percentage of Immigrants from Latin America in Nebraska is 3.92%.
What is the Percentage of Immigrants from Latin America in the United States?
Percentage of Immigrants from Latin America in the United States is 6.84%.