Zip Codes with the Highest Percentage of Population Employed in Accommodation & Food Services in Moss Point, MS
RELATED REPORTS & OPTIONS
Accommodation & Food Services
Moss Point
Compare Zip Codes
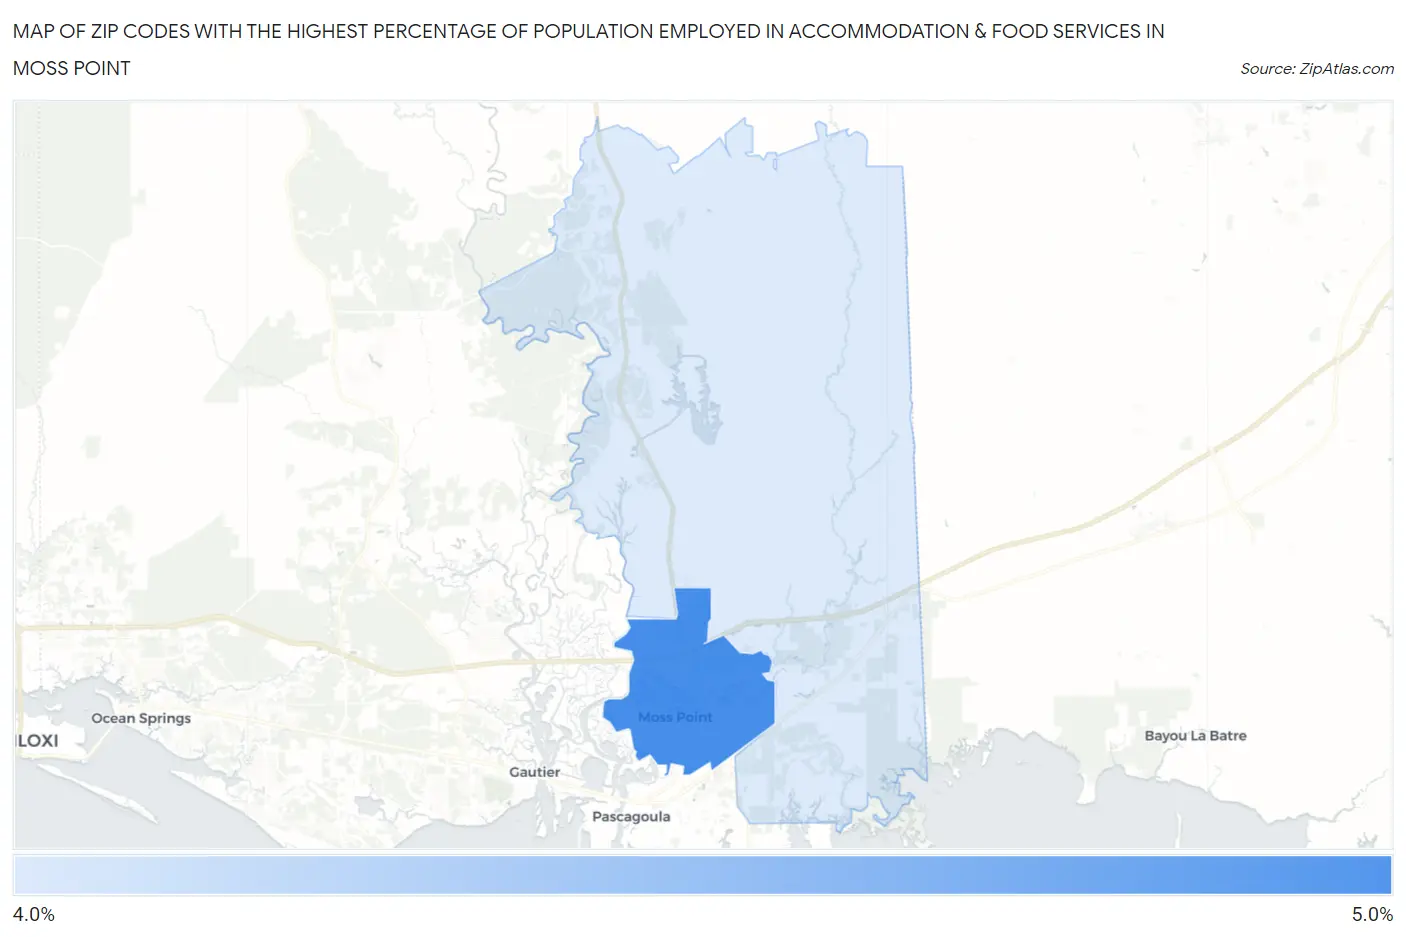
Map of Zip Codes with the Highest Percentage of Population Employed in Accommodation & Food Services in Moss Point
0.0%
5.0%
Zip Codes with the Highest Percentage of Population Employed in Accommodation & Food Services in Moss Point, MS
| Zip Code | % Employed | vs State | vs National | |
| 1. | 39563 | 4.6% | 6.9%(-2.33)#216 | 6.9%(-2.30)#18,225 |
| 2. | 39562 | 4.5% | 6.9%(-2.44)#218 | 6.9%(-2.41)#18,624 |
1
Common Questions
What are the Top Zip Codes with the Highest Percentage of Population Employed in Accommodation & Food Services in Moss Point, MS?
Top Zip Codes with the Highest Percentage of Population Employed in Accommodation & Food Services in Moss Point, MS are:
What zip code has the Highest Percentage of Population Employed in Accommodation & Food Services in Moss Point, MS?
39563 has the Highest Percentage of Population Employed in Accommodation & Food Services in Moss Point, MS with 4.6%.
What is the Percentage of Population Employed in Accommodation & Food Services in Moss Point, MS?
Percentage of Population Employed in Accommodation & Food Services in Moss Point is 4.6%.
What is the Percentage of Population Employed in Accommodation & Food Services in Mississippi?
Percentage of Population Employed in Accommodation & Food Services in Mississippi is 6.9%.
What is the Percentage of Population Employed in Accommodation & Food Services in the United States?
Percentage of Population Employed in Accommodation & Food Services in the United States is 6.9%.