Zip Codes with the Highest Percentage of Population Employed in Office & Administration in Moss Point, MS
RELATED REPORTS & OPTIONS
Office & Administration
Moss Point
Compare Zip Codes
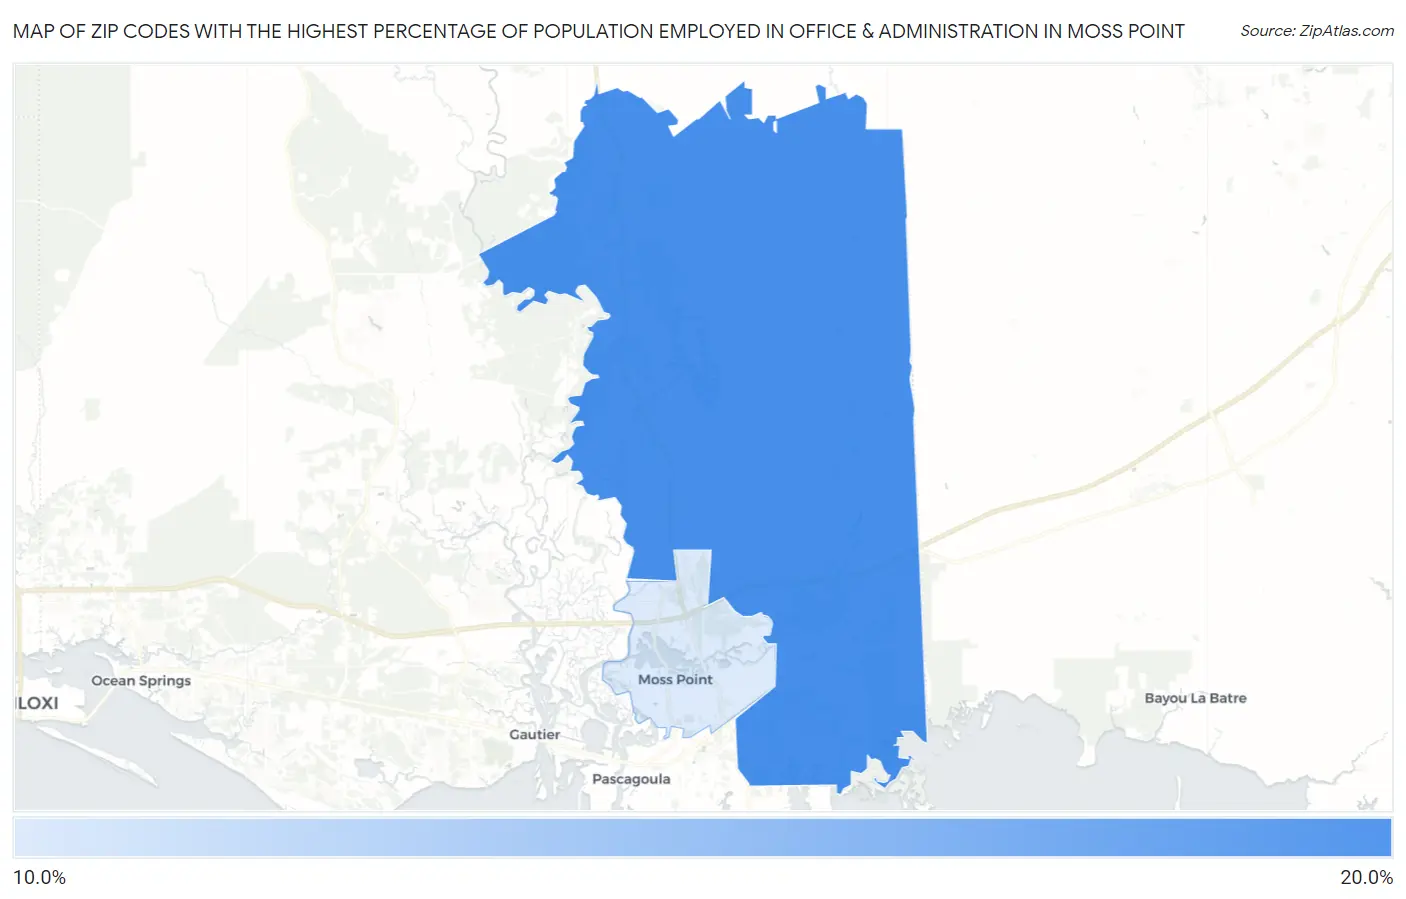
Map of Zip Codes with the Highest Percentage of Population Employed in Office & Administration in Moss Point
0.0%
20.0%
Zip Codes with the Highest Percentage of Population Employed in Office & Administration in Moss Point, MS
| Zip Code | % Employed | vs State | vs National | |
| 1. | 39562 | 15.1% | 10.8%(+4.37)#60 | 10.9%(+4.27)#4,412 |
| 2. | 39563 | 11.2% | 10.8%(+0.413)#168 | 10.9%(+0.310)#13,312 |
1
Common Questions
What are the Top Zip Codes with the Highest Percentage of Population Employed in Office & Administration in Moss Point, MS?
Top Zip Codes with the Highest Percentage of Population Employed in Office & Administration in Moss Point, MS are:
What zip code has the Highest Percentage of Population Employed in Office & Administration in Moss Point, MS?
39562 has the Highest Percentage of Population Employed in Office & Administration in Moss Point, MS with 15.1%.
What is the Percentage of Population Employed in Office & Administration in Moss Point, MS?
Percentage of Population Employed in Office & Administration in Moss Point is 11.1%.
What is the Percentage of Population Employed in Office & Administration in Mississippi?
Percentage of Population Employed in Office & Administration in Mississippi is 10.8%.
What is the Percentage of Population Employed in Office & Administration in the United States?
Percentage of Population Employed in Office & Administration in the United States is 10.9%.