Zip Codes with the Highest Percentage of Population Employed in Food Preparation & Serving in Meridian, MS
RELATED REPORTS & OPTIONS
Food Preparation & Serving
Meridian
Compare Zip Codes
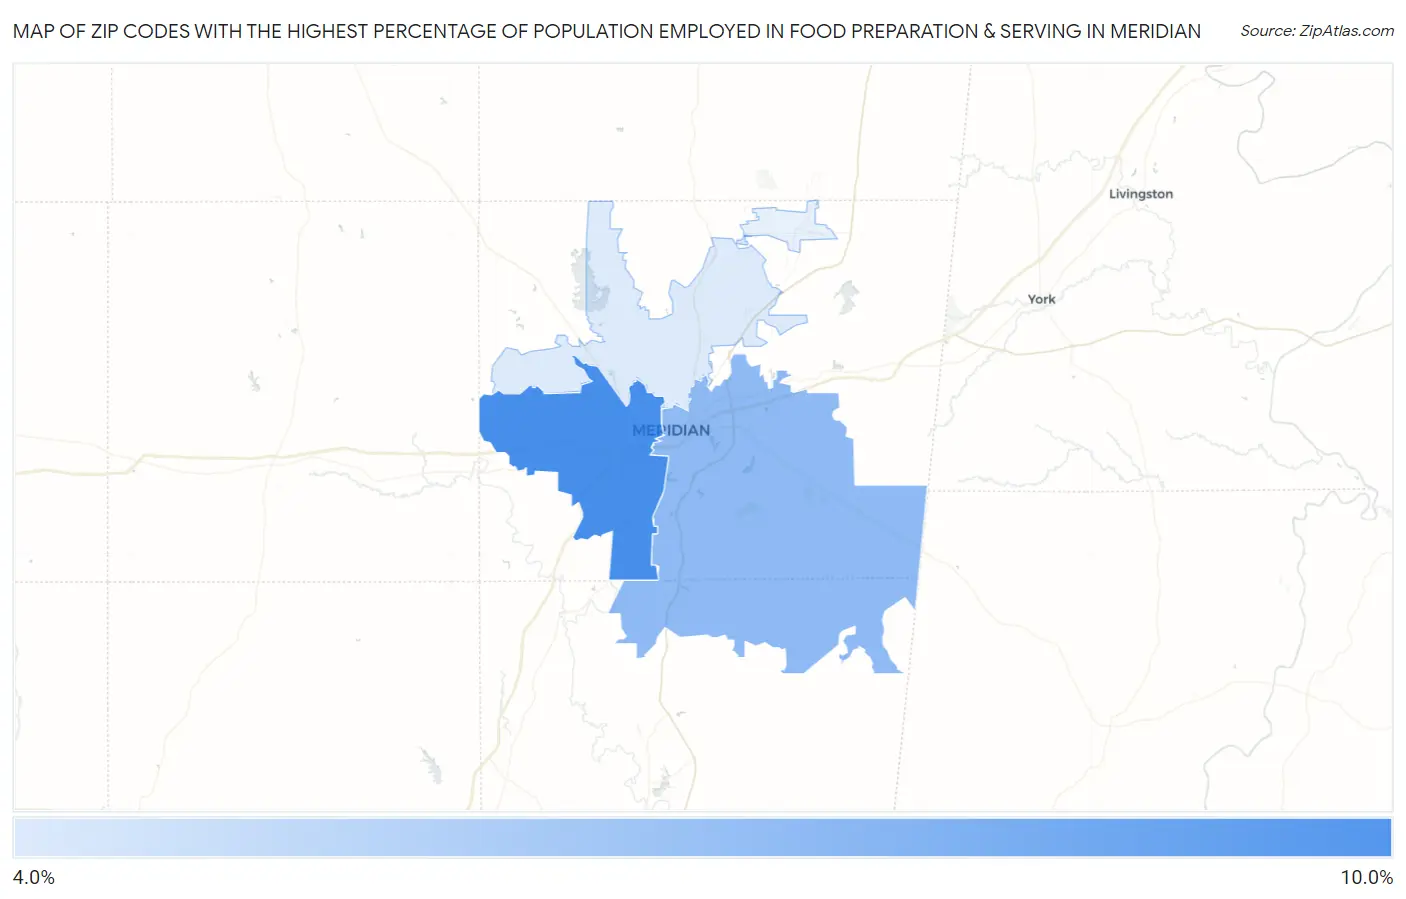
Map of Zip Codes with the Highest Percentage of Population Employed in Food Preparation & Serving in Meridian
0.0%
10.0%
Zip Codes with the Highest Percentage of Population Employed in Food Preparation & Serving in Meridian, MS
| Zip Code | % Employed | vs State | vs National | |
| 1. | 39307 | 9.8% | 5.6%(+4.24)#41 | 5.3%(+4.55)#2,771 |
| 2. | 39301 | 7.0% | 5.6%(+1.44)#84 | 5.3%(+1.74)#6,485 |
| 3. | 39305 | 4.0% | 5.6%(-1.58)#205 | 5.3%(-1.27)#17,083 |
1
Common Questions
What are the Top 3 Zip Codes with the Highest Percentage of Population Employed in Food Preparation & Serving in Meridian, MS?
Top 3 Zip Codes with the Highest Percentage of Population Employed in Food Preparation & Serving in Meridian, MS are:
What zip code has the Highest Percentage of Population Employed in Food Preparation & Serving in Meridian, MS?
39307 has the Highest Percentage of Population Employed in Food Preparation & Serving in Meridian, MS with 9.8%.
What is the Percentage of Population Employed in Food Preparation & Serving in Meridian, MS?
Percentage of Population Employed in Food Preparation & Serving in Meridian is 7.6%.
What is the Percentage of Population Employed in Food Preparation & Serving in Mississippi?
Percentage of Population Employed in Food Preparation & Serving in Mississippi is 5.6%.
What is the Percentage of Population Employed in Food Preparation & Serving in the United States?
Percentage of Population Employed in Food Preparation & Serving in the United States is 5.3%.