Zip Codes with the Highest Percentage of Population Employed in Community & Social Service in Sterling Heights, MI
RELATED REPORTS & OPTIONS
Community & Social Service
Sterling Heights
Compare Zip Codes
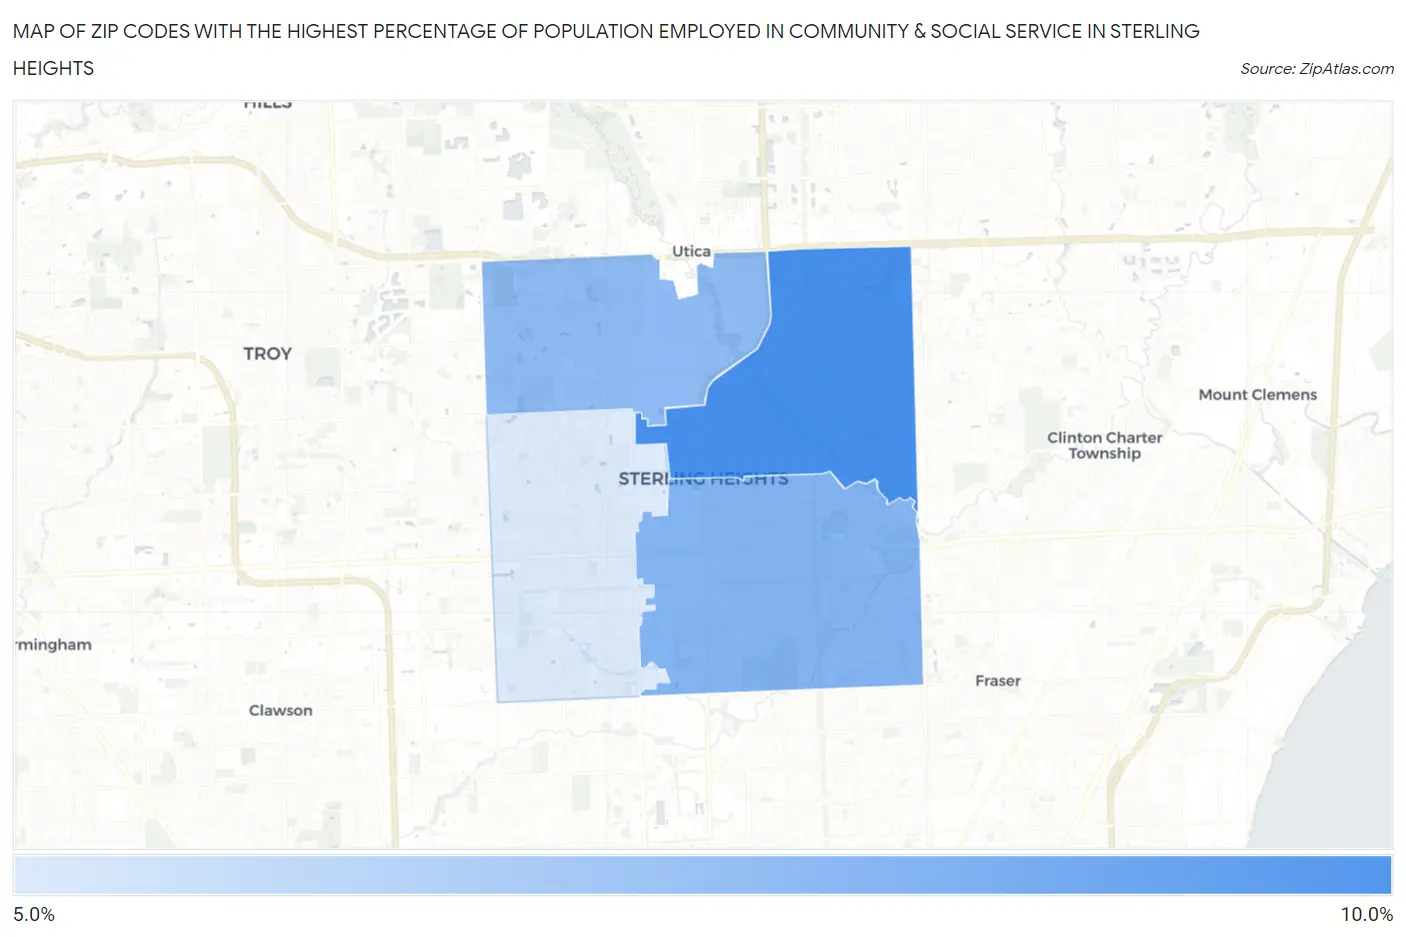
Map of Zip Codes with the Highest Percentage of Population Employed in Community & Social Service in Sterling Heights
0.0%
10.0%
Zip Codes with the Highest Percentage of Population Employed in Community & Social Service in Sterling Heights, MI
| Zip Code | % Employed | vs State | vs National | |
| 1. | 48313 | 8.9% | 9.7%(-0.767)#364 | 11.2%(-2.30)#17,064 |
| 2. | 48312 | 7.7% | 9.7%(-1.94)#490 | 11.2%(-3.48)#20,305 |
| 3. | 48314 | 7.5% | 9.7%(-2.17)#519 | 11.2%(-3.70)#20,857 |
| 4. | 48310 | 6.0% | 9.7%(-3.68)#696 | 11.2%(-5.22)#24,381 |
1
Common Questions
What are the Top 3 Zip Codes with the Highest Percentage of Population Employed in Community & Social Service in Sterling Heights, MI?
Top 3 Zip Codes with the Highest Percentage of Population Employed in Community & Social Service in Sterling Heights, MI are:
What zip code has the Highest Percentage of Population Employed in Community & Social Service in Sterling Heights, MI?
48313 has the Highest Percentage of Population Employed in Community & Social Service in Sterling Heights, MI with 8.9%.
What is the Percentage of Population Employed in Community & Social Service in Sterling Heights, MI?
Percentage of Population Employed in Community & Social Service in Sterling Heights is 7.5%.
What is the Percentage of Population Employed in Community & Social Service in Michigan?
Percentage of Population Employed in Community & Social Service in Michigan is 9.7%.
What is the Percentage of Population Employed in Community & Social Service in the United States?
Percentage of Population Employed in Community & Social Service in the United States is 11.2%.