Zip Codes with the Highest Percentage of Population Employed in Community & Social Service in Southfield, MI
RELATED REPORTS & OPTIONS
Community & Social Service
Southfield
Compare Zip Codes
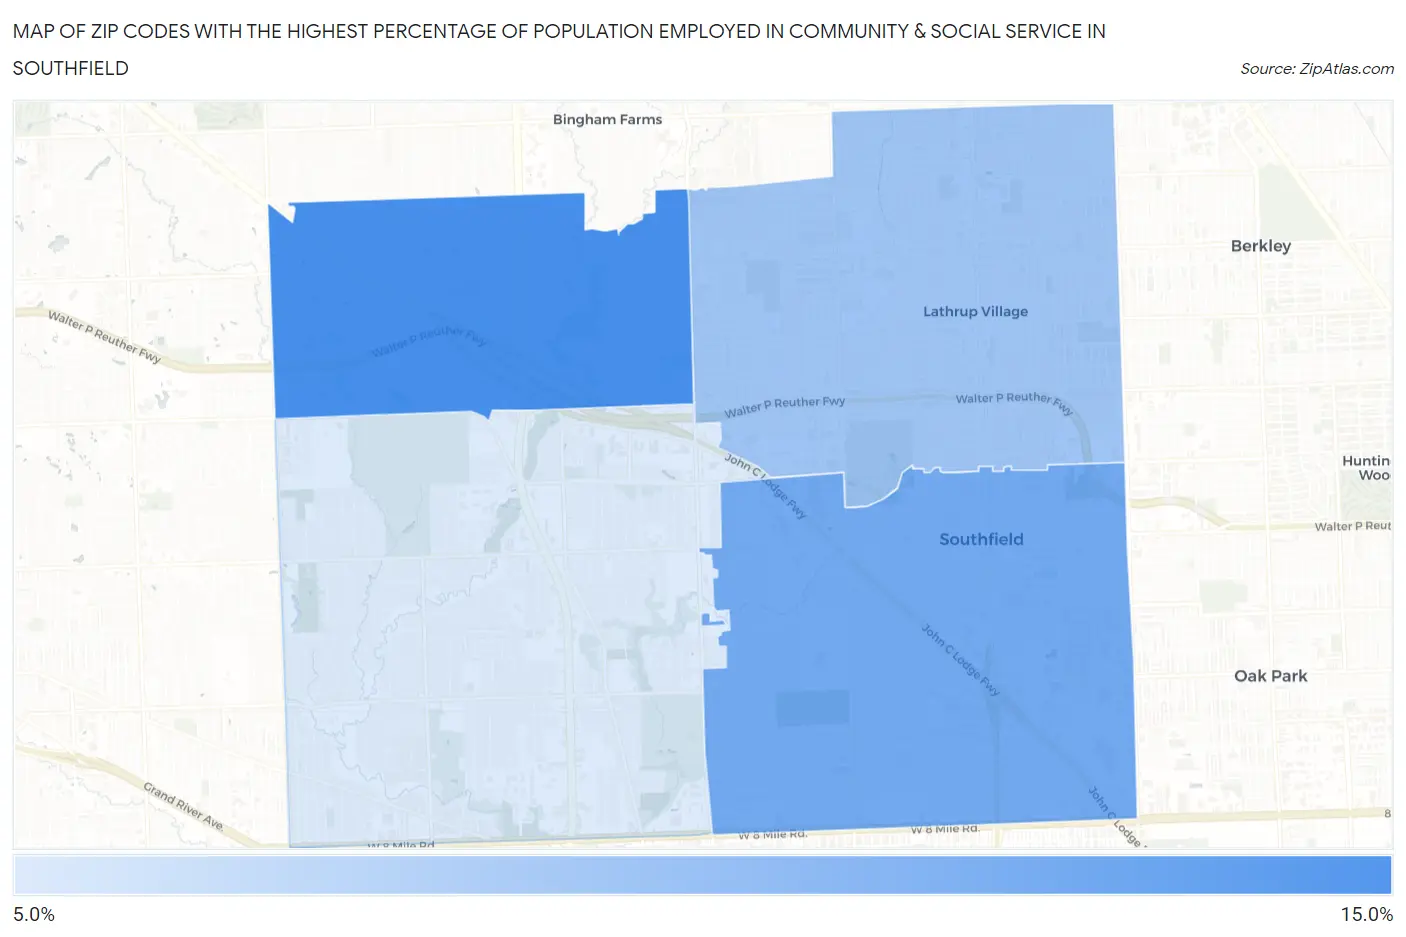
Map of Zip Codes with the Highest Percentage of Population Employed in Community & Social Service in Southfield
0.0%
15.0%
Zip Codes with the Highest Percentage of Population Employed in Community & Social Service in Southfield, MI
| Zip Code | % Employed | vs State | vs National | |
| 1. | 48034 | 12.7% | 9.7%(+2.97)#126 | 11.2%(+1.44)#8,160 |
| 2. | 48075 | 11.6% | 9.7%(+1.96)#173 | 11.2%(+0.424)#10,138 |
| 3. | 48076 | 10.7% | 9.7%(+0.996)#224 | 11.2%(-0.541)#12,451 |
| 4. | 48033 | 9.3% | 9.7%(-0.427)#332 | 11.2%(-1.96)#16,124 |
1
Common Questions
What are the Top 3 Zip Codes with the Highest Percentage of Population Employed in Community & Social Service in Southfield, MI?
Top 3 Zip Codes with the Highest Percentage of Population Employed in Community & Social Service in Southfield, MI are:
What zip code has the Highest Percentage of Population Employed in Community & Social Service in Southfield, MI?
48034 has the Highest Percentage of Population Employed in Community & Social Service in Southfield, MI with 12.7%.
What is the Percentage of Population Employed in Community & Social Service in Southfield, MI?
Percentage of Population Employed in Community & Social Service in Southfield is 11.4%.
What is the Percentage of Population Employed in Community & Social Service in Michigan?
Percentage of Population Employed in Community & Social Service in Michigan is 9.7%.
What is the Percentage of Population Employed in Community & Social Service in the United States?
Percentage of Population Employed in Community & Social Service in the United States is 11.2%.