Zip Codes with the Highest Percentage of Population Employed in Arts, Entertainment & Recreation in Amherst, MA
RELATED REPORTS & OPTIONS
Arts, Entertainment & Recreation
Amherst
Compare Zip Codes
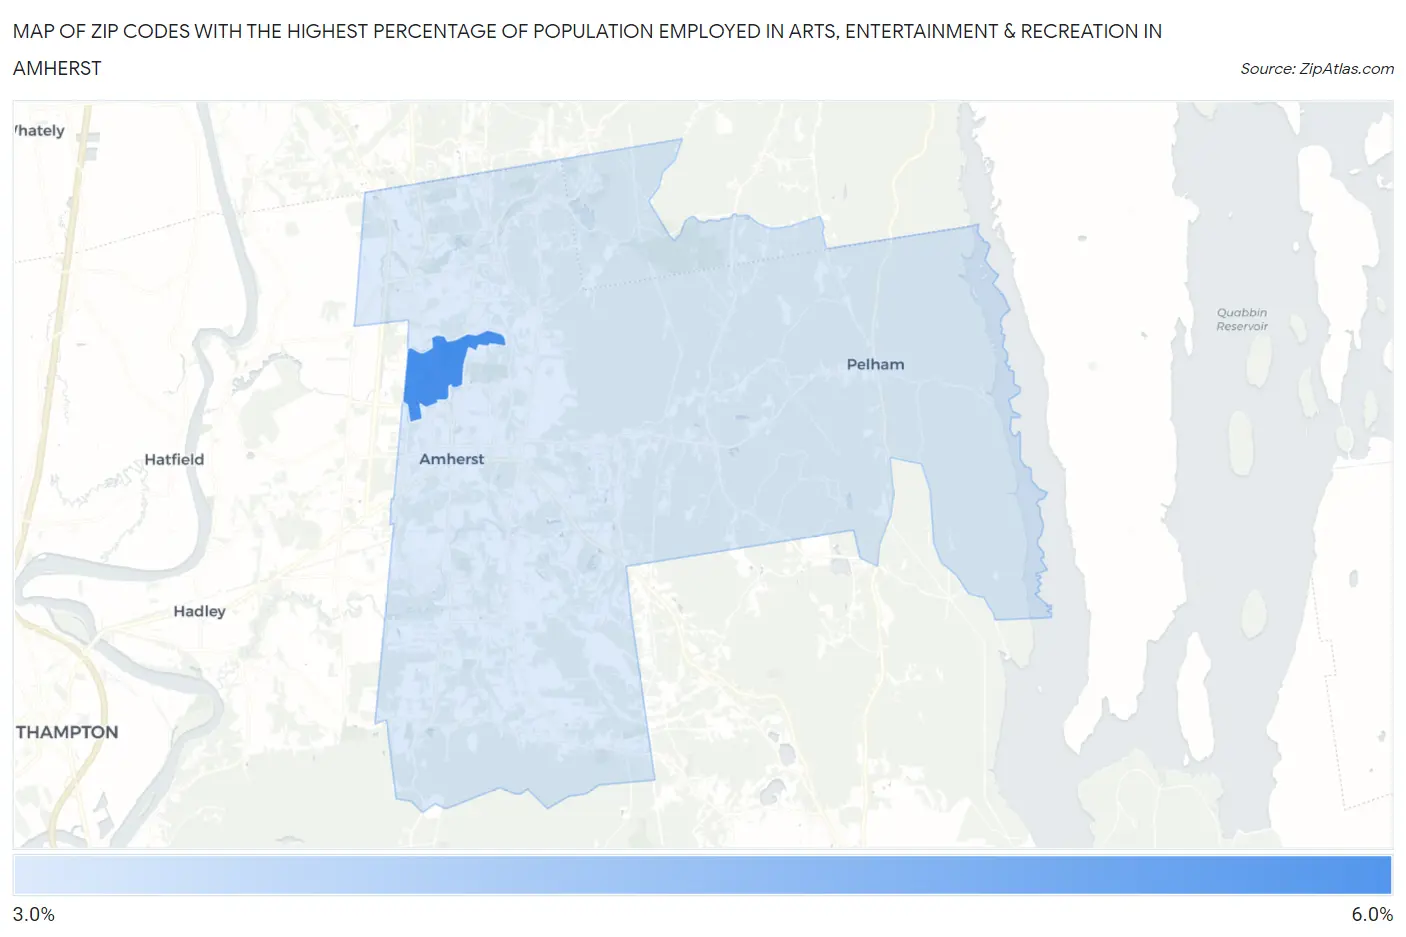
Map of Zip Codes with the Highest Percentage of Population Employed in Arts, Entertainment & Recreation in Amherst
0.0%
6.0%
Zip Codes with the Highest Percentage of Population Employed in Arts, Entertainment & Recreation in Amherst, MA
| Zip Code | % Employed | vs State | vs National | |
| 1. | 01003 | 5.2% | 2.0%(+3.26)#39 | 2.1%(+3.16)#2,124 |
| 2. | 01002 | 3.1% | 2.0%(+1.11)#112 | 2.1%(+1.00)#5,108 |
1
Common Questions
What are the Top Zip Codes with the Highest Percentage of Population Employed in Arts, Entertainment & Recreation in Amherst, MA?
Top Zip Codes with the Highest Percentage of Population Employed in Arts, Entertainment & Recreation in Amherst, MA are:
What zip code has the Highest Percentage of Population Employed in Arts, Entertainment & Recreation in Amherst, MA?
01003 has the Highest Percentage of Population Employed in Arts, Entertainment & Recreation in Amherst, MA with 5.2%.
What is the Percentage of Population Employed in Arts, Entertainment & Recreation in Amherst, MA?
Percentage of Population Employed in Arts, Entertainment & Recreation in Amherst is 3.6%.
What is the Percentage of Population Employed in Arts, Entertainment & Recreation in Massachusetts?
Percentage of Population Employed in Arts, Entertainment & Recreation in Massachusetts is 2.0%.
What is the Percentage of Population Employed in Arts, Entertainment & Recreation in the United States?
Percentage of Population Employed in Arts, Entertainment & Recreation in the United States is 2.1%.