Zimbabwean vs Immigrants from Switzerland In Labor Force | Age 25-29

COMPARE

Zimbabwean
Race
Ancestry
AfghanAfricanAlaska NativeAlaskan AthabascanAlbanianAleutAlsatianAmericanApacheArabArapahoArgentineanArmenianAssyrian/Chaldean/SyriacAustralianAustrianBahamianBangladeshiBarbadianBasqueBelgianBelizeanBermudanBhutaneseBlackfeetBolivianBrazilianBritishBritish West IndianBulgarianBurmeseCajunCambodianCanadianCape VerdeanCarpatho RusynCelticCentral AmericanCentral American IndianCherokeeCheyenneChickasawChileanChineseChippewaChoctawColombianColvilleComancheCosta RicanCreeCreekCroatianCrowCubanCypriotCzechCzechoslovakianDanishDelawareDominicanDutchDutch West IndianEastern EuropeanEcuadorianEgyptianEnglishEstonianEthiopianEuropeanFijianFilipinoFinnishFrenchFrench American IndianFrench CanadianGermanGerman RussianGhanaianGreekGuamanian/ChamorroGuatemalanGuyaneseHaitianHmongHonduranHopiHoumaHungarianIcelanderIndian (Asian)IndonesianInupiatIranianIraqiIrishIroquoisIsraeliItalianJamaicanJapaneseJordanianKenyanKiowaKoreanLaotianLatvianLebaneseLiberianLithuanianLumbeeLuxembourgerMacedonianMalaysianMalteseMarshalleseMenomineeMexicanMexican American IndianMongolianMoroccanNative HawaiianNavajoNepaleseNew ZealanderNicaraguanNigerianNorthern EuropeanNorwegianOkinawanOsageOttawaPaiutePakistaniPalestinianPanamanianParaguayanPennsylvania GermanPeruvianPimaPolishPortuguesePotawatomiPuebloPuerto RicanPuget Sound SalishRomanianRussianSalvadoranSamoanScandinavianScotch-IrishScottishSeminoleSenegaleseSerbianShoshoneSierra LeoneanSiouxSlavicSlovakSloveneSomaliSouth AfricanSouth AmericanSouth American IndianSoviet UnionSpaniardSpanishSpanish AmericanSpanish American IndianSri LankanSubsaharan AfricanSudaneseSwedishSwissSyrianTaiwaneseThaiTlingit-HaidaTohono O'OdhamTonganTrinidadian and TobagonianTsimshianTurkishU.S. Virgin IslanderUgandanUkrainianUruguayanUteVenezuelanVietnameseWelshWest IndianYakamaYaquiYugoslavianYumanYup'ikZimbabwean
Immigration
NonimmigrantsImmigrantsAfghanistanAfricaAlbaniaArgentinaArmeniaAsiaAustraliaAustriaBahamasBangladeshBarbadosBelarusBelgiumBelizeBoliviaBosnia and HerzegovinaBrazilBulgariaBurma/MyanmarCabo VerdeCambodiaCameroonCanadaCaribbeanCentral AmericaChileChinaColombiaCongoCosta RicaCroatiaCubaCzechoslovakiaDenmarkDominicaDominican RepublicEastern AfricaEastern AsiaEastern EuropeEcuadorEgyptEl SalvadorEnglandEritreaEthiopiaEuropeFijiFranceGermanyGhanaGreeceGrenadaGuatemalaGuyanaHaitiHondurasHong KongHungaryIndiaIndonesiaIranIraqIrelandIsraelItalyJamaicaJapanJordanKazakhstanKenyaKoreaKuwaitLaosLatin AmericaLatviaLebanonLiberiaLithuaniaMalaysiaMexicoMicronesiaMiddle AfricaMoldovaMoroccoNepalNetherlandsNicaraguaNigeriaNorth AmericaNorth MacedoniaNorthern AfricaNorthern EuropeNorwayOceaniaPakistanPanamaPeruPhilippinesPolandPortugalRomaniaRussiaSaudi ArabiaScotlandSenegalSerbiaSierra LeoneSingaporeSomaliaSouth AfricaSouth AmericaSouth Central AsiaSouth Eastern AsiaSouthern EuropeSpainSri LankaSt. Vincent and the GrenadinesSudanSwedenSyriaTaiwanThailandTrinidad and TobagoTurkeyUgandaUkraineUruguayUzbekistanVenezuelaVietnamWest IndiesWestern AfricaWestern AsiaWestern EuropeYemenZaireZimbabweAzores
Immigrants from Switzerland
Race
Ancestry
AfghanAfricanAlaska NativeAlaskan AthabascanAlbanianAleutAlsatianAmericanApacheArabArapahoArgentineanArmenianAssyrian/Chaldean/SyriacAustralianAustrianBahamianBangladeshiBarbadianBasqueBelgianBelizeanBermudanBhutaneseBlackfeetBolivianBrazilianBritishBritish West IndianBulgarianBurmeseCajunCambodianCanadianCape VerdeanCarpatho RusynCelticCentral AmericanCentral American IndianCherokeeCheyenneChickasawChileanChineseChippewaChoctawColombianColvilleComancheCosta RicanCreeCreekCroatianCrowCubanCypriotCzechCzechoslovakianDanishDelawareDominicanDutchDutch West IndianEastern EuropeanEcuadorianEgyptianEnglishEstonianEthiopianEuropeanFijianFilipinoFinnishFrenchFrench American IndianFrench CanadianGermanGerman RussianGhanaianGreekGuamanian/ChamorroGuatemalanGuyaneseHaitianHmongHonduranHopiHoumaHungarianIcelanderIndian (Asian)IndonesianInupiatIranianIraqiIrishIroquoisIsraeliItalianJamaicanJapaneseJordanianKenyanKiowaKoreanLaotianLatvianLebaneseLiberianLithuanianLumbeeLuxembourgerMacedonianMalaysianMalteseMarshalleseMenomineeMexicanMexican American IndianMongolianMoroccanNative HawaiianNavajoNepaleseNew ZealanderNicaraguanNigerianNorthern EuropeanNorwegianOkinawanOsageOttawaPaiutePakistaniPalestinianPanamanianParaguayanPennsylvania GermanPeruvianPimaPolishPortuguesePotawatomiPuebloPuerto RicanPuget Sound SalishRomanianRussianSalvadoranSamoanScandinavianScotch-IrishScottishSeminoleSenegaleseSerbianShoshoneSierra LeoneanSiouxSlavicSlovakSloveneSomaliSouth AfricanSouth AmericanSouth American IndianSoviet UnionSpaniardSpanishSpanish AmericanSpanish American IndianSri LankanSubsaharan AfricanSudaneseSwedishSwissSyrianTaiwaneseThaiTlingit-HaidaTohono O'OdhamTonganTrinidadian and TobagonianTsimshianTurkishU.S. Virgin IslanderUgandanUkrainianUruguayanUteVenezuelanVietnameseWelshWest IndianYakamaYaquiYugoslavianYumanYup'ik
Immigration
NonimmigrantsImmigrantsAfghanistanAfricaAlbaniaArgentinaArmeniaAsiaAustraliaAustriaBahamasBangladeshBarbadosBelarusBelgiumBelizeBoliviaBosnia and HerzegovinaBrazilBulgariaBurma/MyanmarCabo VerdeCambodiaCameroonCanadaCaribbeanCentral AmericaChileChinaColombiaCongoCosta RicaCroatiaCubaCzechoslovakiaDenmarkDominicaDominican RepublicEastern AfricaEastern AsiaEastern EuropeEcuadorEgyptEl SalvadorEnglandEritreaEthiopiaEuropeFijiFranceGermanyGhanaGreeceGrenadaGuatemalaGuyanaHaitiHondurasHong KongHungaryIndiaIndonesiaIranIraqIrelandIsraelItalyJamaicaJapanJordanKazakhstanKenyaKoreaKuwaitLaosLatin AmericaLatviaLebanonLiberiaLithuaniaMalaysiaMexicoMicronesiaMiddle AfricaMoldovaMoroccoNepalNetherlandsNicaraguaNigeriaNorth AmericaNorth MacedoniaNorthern AfricaNorthern EuropeNorwayOceaniaPakistanPanamaPeruPhilippinesPolandPortugalRomaniaRussiaSaudi ArabiaScotlandSenegalSerbiaSierra LeoneSingaporeSomaliaSouth AfricaSouth AmericaSouth Central AsiaSouth Eastern AsiaSouthern EuropeSpainSri LankaSt. Vincent and the GrenadinesSudanSwedenSwitzerlandSyriaTaiwanThailandTrinidad and TobagoTurkeyUgandaUkraineUruguayUzbekistanVenezuelaVietnamWest IndiesWestern AfricaWestern AsiaWestern EuropeYemenZaireZimbabweAzores
In Labor Force | Age 25-29
Income
Poverty
Unemployment
Labor Participation
Family Structure
Vehicle Availability
Education Level
Disability

In Labor Force | Age 25-29 Comparison

Zimbabweans

Immigrants from Switzerland

Fair
Exceptional
84.5%
IN LABOR FORCE | AGE 25-29
28.7/ 100
METRIC RATING
191st/ 347
METRIC RANK
85.1%
IN LABOR FORCE | AGE 25-29
93.9/ 100
METRIC RATING
100th/ 347
METRIC RANK

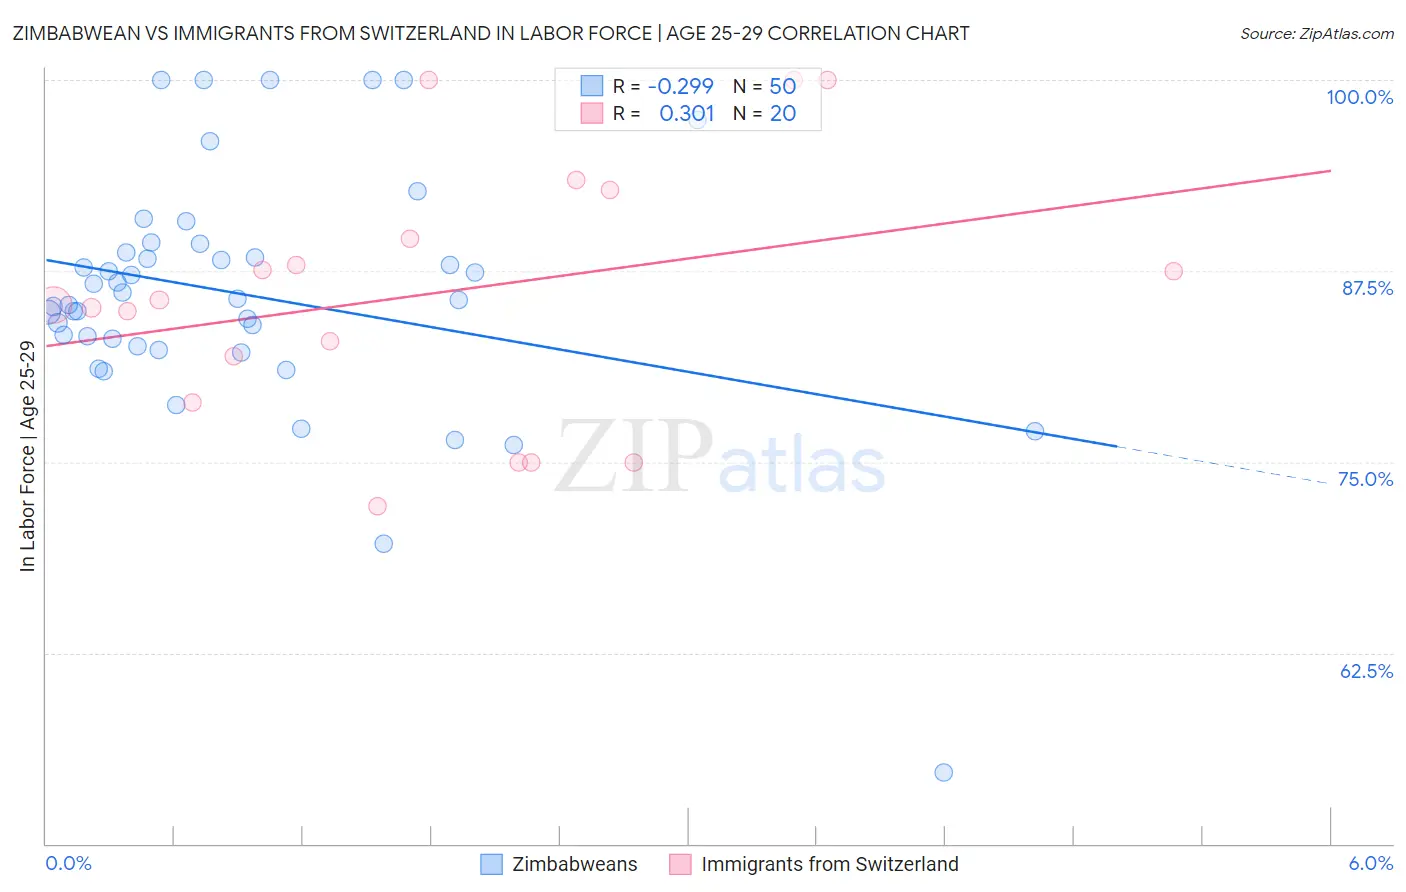
Zimbabwean vs Immigrants from Switzerland In Labor Force | Age 25-29 Correlation Chart

The statistical analysis conducted on geographies consisting of 69,201,271 people shows a weak negative correlation between the proportion of Zimbabweans and labor force participation rate among population between the ages 25 and 29 in the United States with a correlation coefficient (R) of -0.299 and weighted average of 84.5%. Similarly, the statistical analysis conducted on geographies consisting of 148,053,964 people shows a mild positive correlation between the proportion of Immigrants from Switzerland and labor force participation rate among population between the ages 25 and 29 in the United States with a correlation coefficient (R) of 0.301 and weighted average of 85.1%, a difference of 0.67%.
Zimbabwean vs Immigrants from Switzerland In Labor Force | Age 25-29

In Labor Force | Age 25-29 Correlation Summary

MeasurementZimbabweanImmigrants from Switzerland
Minimum54.7%72.1%
Maximum100.0%100.0%
Range45.3%27.9%
Mean85.9%86.0%
Median85.6%85.4%
Interquartile 25% (IQ1)82.6%80.4%
Interquartile 75% (IQ3)88.7%91.2%
Interquartile Range (IQR)6.1%10.8%
Standard Deviation (Sample)8.0%8.4%
Standard Deviation (Population)8.0%8.2%

Similar Demographics by In Labor Force | Age 25-29

Demographics Similar to Zimbabweans by In Labor Force | Age 25-29

In terms of in labor force | age 25-29, the demographic groups most similar to Zimbabweans are Welsh (84.5%, a difference of 0.020%), Moroccan (84.5%, a difference of 0.030%), English (84.5%, a difference of 0.030%), South American Indian (84.5%, a difference of 0.030%), and Immigrants from Ukraine (84.5%, a difference of 0.040%).
DemographicsRating | RankIn Labor Force | Age 25-29
Immigrants | Kuwait
38.2
/100
|
#184
Fair
84.6%
Immigrants | Denmark
37.0
/100
|
#185
Fair
84.6%
Immigrants | Belgium
35.0
/100
|
#186
Fair
84.6%
Immigrants | Portugal
34.7
/100
|
#187
Fair
84.6%
Immigrants | Ukraine
33.7
/100
|
#188
Fair
84.5%
Moroccans
32.6
/100
|
#189
Fair
84.5%
Welsh
31.1
/100
|
#190
Fair
84.5%
Zimbabweans
28.7
/100
|
#191
Fair
84.5%
English
25.8
/100
|
#192
Fair
84.5%
South American Indians
25.0
/100
|
#193
Fair
84.5%
Portuguese
21.2
/100
|
#194
Fair
84.4%
Immigrants | Israel
20.8
/100
|
#195
Fair
84.4%
Immigrants | South Eastern Asia
19.5
/100
|
#196
Poor
84.4%
Tlingit-Haida
19.3
/100
|
#197
Poor
84.4%
Immigrants | Iraq
19.0
/100
|
#198
Poor
84.4%

Demographics Similar to Immigrants from Switzerland by In Labor Force | Age 25-29

In terms of in labor force | age 25-29, the demographic groups most similar to Immigrants from Switzerland are Bangladeshi (85.1%, a difference of 0.0%), Egyptian (85.1%, a difference of 0.0%), Immigrants from Sudan (85.1%, a difference of 0.010%), Mongolian (85.1%, a difference of 0.010%), and Slavic (85.1%, a difference of 0.010%).
DemographicsRating | RankIn Labor Force | Age 25-29
Austrians
95.3
/100
|
#93
Exceptional
85.1%
Immigrants | Korea
94.8
/100
|
#94
Exceptional
85.1%
Immigrants | Netherlands
94.6
/100
|
#95
Exceptional
85.1%
Immigrants | Romania
94.6
/100
|
#96
Exceptional
85.1%
Immigrants | Sudan
94.3
/100
|
#97
Exceptional
85.1%
Mongolians
94.1
/100
|
#98
Exceptional
85.1%
Bangladeshis
94.0
/100
|
#99
Exceptional
85.1%
Immigrants | Switzerland
93.9
/100
|
#100
Exceptional
85.1%
Egyptians
93.8
/100
|
#101
Exceptional
85.1%
Slavs
93.7
/100
|
#102
Exceptional
85.1%
Immigrants | Japan
93.5
/100
|
#103
Exceptional
85.1%
Immigrants | Zaire
93.3
/100
|
#104
Exceptional
85.1%
Immigrants | Hong Kong
92.8
/100
|
#105
Exceptional
85.0%
Czechoslovakians
92.6
/100
|
#106
Exceptional
85.0%
Immigrants | Southern Europe
92.3
/100
|
#107
Exceptional
85.0%