Slavic vs Peruvian In Labor Force | Age 20-24

COMPARE

Slavic
Race
Ancestry
AfghanAfricanAlaska NativeAlaskan AthabascanAlbanianAleutAlsatianAmericanApacheArabArapahoArgentineanArmenianAssyrian/Chaldean/SyriacAustralianAustrianBahamianBangladeshiBarbadianBasqueBelgianBelizeanBermudanBhutaneseBlackfeetBolivianBrazilianBritishBritish West IndianBulgarianBurmeseCajunCambodianCanadianCape VerdeanCarpatho RusynCelticCentral AmericanCentral American IndianCherokeeCheyenneChickasawChileanChineseChippewaChoctawColombianColvilleComancheCosta RicanCreeCreekCroatianCrowCubanCypriotCzechCzechoslovakianDanishDelawareDominicanDutchDutch West IndianEastern EuropeanEcuadorianEgyptianEnglishEstonianEthiopianEuropeanFijianFilipinoFinnishFrenchFrench American IndianFrench CanadianGermanGerman RussianGhanaianGreekGuamanian/ChamorroGuatemalanGuyaneseHaitianHmongHonduranHopiHoumaHungarianIcelanderIndian (Asian)IndonesianInupiatIranianIraqiIrishIroquoisIsraeliItalianJamaicanJapaneseJordanianKenyanKiowaKoreanLaotianLatvianLebaneseLiberianLithuanianLumbeeLuxembourgerMacedonianMalaysianMalteseMarshalleseMenomineeMexicanMexican American IndianMongolianMoroccanNative HawaiianNavajoNepaleseNew ZealanderNicaraguanNigerianNorthern EuropeanNorwegianOkinawanOsageOttawaPaiutePakistaniPalestinianPanamanianParaguayanPennsylvania GermanPimaPolishPortuguesePotawatomiPuebloPuerto RicanPuget Sound SalishRomanianRussianSalvadoranSamoanScandinavianScotch-IrishScottishSeminoleSenegaleseSerbianShoshoneSierra LeoneanSiouxSlavicSlovakSloveneSomaliSouth AfricanSouth AmericanSouth American IndianSoviet UnionSpaniardSpanishSpanish AmericanSpanish American IndianSri LankanSubsaharan AfricanSudaneseSwedishSwissSyrianTaiwaneseThaiTlingit-HaidaTohono O'OdhamTonganTrinidadian and TobagonianTsimshianTurkishU.S. Virgin IslanderUgandanUkrainianUruguayanUteVenezuelanVietnameseWelshWest IndianYakamaYaquiYugoslavianYumanYup'ikZimbabwean
Immigration
NonimmigrantsImmigrantsAfghanistanAfricaAlbaniaArgentinaArmeniaAsiaAustraliaAustriaBahamasBangladeshBarbadosBelarusBelgiumBelizeBoliviaBosnia and HerzegovinaBrazilBulgariaBurma/MyanmarCabo VerdeCambodiaCameroonCanadaCaribbeanCentral AmericaChileChinaColombiaCongoCosta RicaCroatiaCubaCzechoslovakiaDenmarkDominicaDominican RepublicEastern AfricaEastern AsiaEastern EuropeEcuadorEgyptEl SalvadorEnglandEritreaEthiopiaEuropeFijiFranceGermanyGhanaGreeceGrenadaGuatemalaGuyanaHaitiHondurasHong KongHungaryIndiaIndonesiaIranIraqIrelandIsraelItalyJamaicaJapanJordanKazakhstanKenyaKoreaKuwaitLaosLatin AmericaLatviaLebanonLiberiaLithuaniaMalaysiaMexicoMicronesiaMiddle AfricaMoldovaMoroccoNepalNetherlandsNicaraguaNigeriaNorth AmericaNorth MacedoniaNorthern AfricaNorthern EuropeNorwayOceaniaPakistanPanamaPeruPhilippinesPolandPortugalRomaniaRussiaSaudi ArabiaScotlandSenegalSerbiaSierra LeoneSingaporeSomaliaSouth AfricaSouth AmericaSouth Central AsiaSouth Eastern AsiaSouthern EuropeSpainSri LankaSt. Vincent and the GrenadinesSudanSwedenSwitzerlandSyriaTaiwanThailandTrinidad and TobagoTurkeyUgandaUkraineUruguayUzbekistanVenezuelaVietnamWest IndiesWestern AfricaWestern AsiaWestern EuropeYemenZaireZimbabweAzores
Peruvian
Race
Ancestry
AfghanAfricanAlaska NativeAlaskan AthabascanAlbanianAleutAlsatianAmericanApacheArabArapahoArgentineanArmenianAssyrian/Chaldean/SyriacAustralianAustrianBahamianBangladeshiBarbadianBasqueBelgianBelizeanBermudanBhutaneseBlackfeetBolivianBrazilianBritishBritish West IndianBulgarianBurmeseCajunCambodianCanadianCape VerdeanCarpatho RusynCelticCentral AmericanCentral American IndianCherokeeCheyenneChickasawChileanChineseChippewaChoctawColombianColvilleComancheCosta RicanCreeCreekCroatianCrowCubanCypriotCzechCzechoslovakianDanishDelawareDominicanDutchDutch West IndianEastern EuropeanEcuadorianEgyptianEnglishEstonianEthiopianEuropeanFijianFilipinoFinnishFrenchFrench American IndianFrench CanadianGermanGerman RussianGhanaianGreekGuamanian/ChamorroGuatemalanGuyaneseHaitianHmongHonduranHopiHoumaHungarianIcelanderIndian (Asian)IndonesianInupiatIranianIraqiIrishIroquoisIsraeliItalianJamaicanJapaneseJordanianKenyanKiowaKoreanLaotianLatvianLebaneseLiberianLithuanianLumbeeLuxembourgerMacedonianMalaysianMalteseMarshalleseMenomineeMexicanMexican American IndianMongolianMoroccanNative HawaiianNavajoNepaleseNew ZealanderNicaraguanNigerianNorthern EuropeanNorwegianOkinawanOsageOttawaPaiutePakistaniPalestinianPanamanianParaguayanPennsylvania GermanPeruvianPimaPolishPortuguesePotawatomiPuebloPuerto RicanPuget Sound SalishRomanianRussianSalvadoranSamoanScandinavianScotch-IrishScottishSeminoleSenegaleseSerbianShoshoneSierra LeoneanSiouxSlovakSloveneSomaliSouth AfricanSouth AmericanSouth American IndianSoviet UnionSpaniardSpanishSpanish AmericanSpanish American IndianSri LankanSubsaharan AfricanSudaneseSwedishSwissSyrianTaiwaneseThaiTlingit-HaidaTohono O'OdhamTonganTrinidadian and TobagonianTsimshianTurkishU.S. Virgin IslanderUgandanUkrainianUruguayanUteVenezuelanVietnameseWelshWest IndianYakamaYaquiYugoslavianYumanYup'ikZimbabwean
Immigration
NonimmigrantsImmigrantsAfghanistanAfricaAlbaniaArgentinaArmeniaAsiaAustraliaAustriaBahamasBangladeshBarbadosBelarusBelgiumBelizeBoliviaBosnia and HerzegovinaBrazilBulgariaBurma/MyanmarCabo VerdeCambodiaCameroonCanadaCaribbeanCentral AmericaChileChinaColombiaCongoCosta RicaCroatiaCubaCzechoslovakiaDenmarkDominicaDominican RepublicEastern AfricaEastern AsiaEastern EuropeEcuadorEgyptEl SalvadorEnglandEritreaEthiopiaEuropeFijiFranceGermanyGhanaGreeceGrenadaGuatemalaGuyanaHaitiHondurasHong KongHungaryIndiaIndonesiaIranIraqIrelandIsraelItalyJamaicaJapanJordanKazakhstanKenyaKoreaKuwaitLaosLatin AmericaLatviaLebanonLiberiaLithuaniaMalaysiaMexicoMicronesiaMiddle AfricaMoldovaMoroccoNepalNetherlandsNicaraguaNigeriaNorth AmericaNorth MacedoniaNorthern AfricaNorthern EuropeNorwayOceaniaPakistanPanamaPeruPhilippinesPolandPortugalRomaniaRussiaSaudi ArabiaScotlandSenegalSerbiaSierra LeoneSingaporeSomaliaSouth AfricaSouth AmericaSouth Central AsiaSouth Eastern AsiaSouthern EuropeSpainSri LankaSt. Vincent and the GrenadinesSudanSwedenSwitzerlandSyriaTaiwanThailandTrinidad and TobagoTurkeyUgandaUkraineUruguayUzbekistanVenezuelaVietnamWest IndiesWestern AfricaWestern AsiaWestern EuropeYemenZaireZimbabweAzores
In Labor Force | Age 20-24
Income
Poverty
Unemployment
Labor Participation
Family Structure
Vehicle Availability
Education Level
Disability

In Labor Force | Age 20-24 Comparison

Slavs

Peruvians

Exceptional
Poor
76.9%
IN LABOR FORCE | AGE 20-24
99.9/ 100
METRIC RATING
67th/ 347
METRIC RANK
74.5%
IN LABOR FORCE | AGE 20-24
13.3/ 100
METRIC RATING
213th/ 347
METRIC RANK

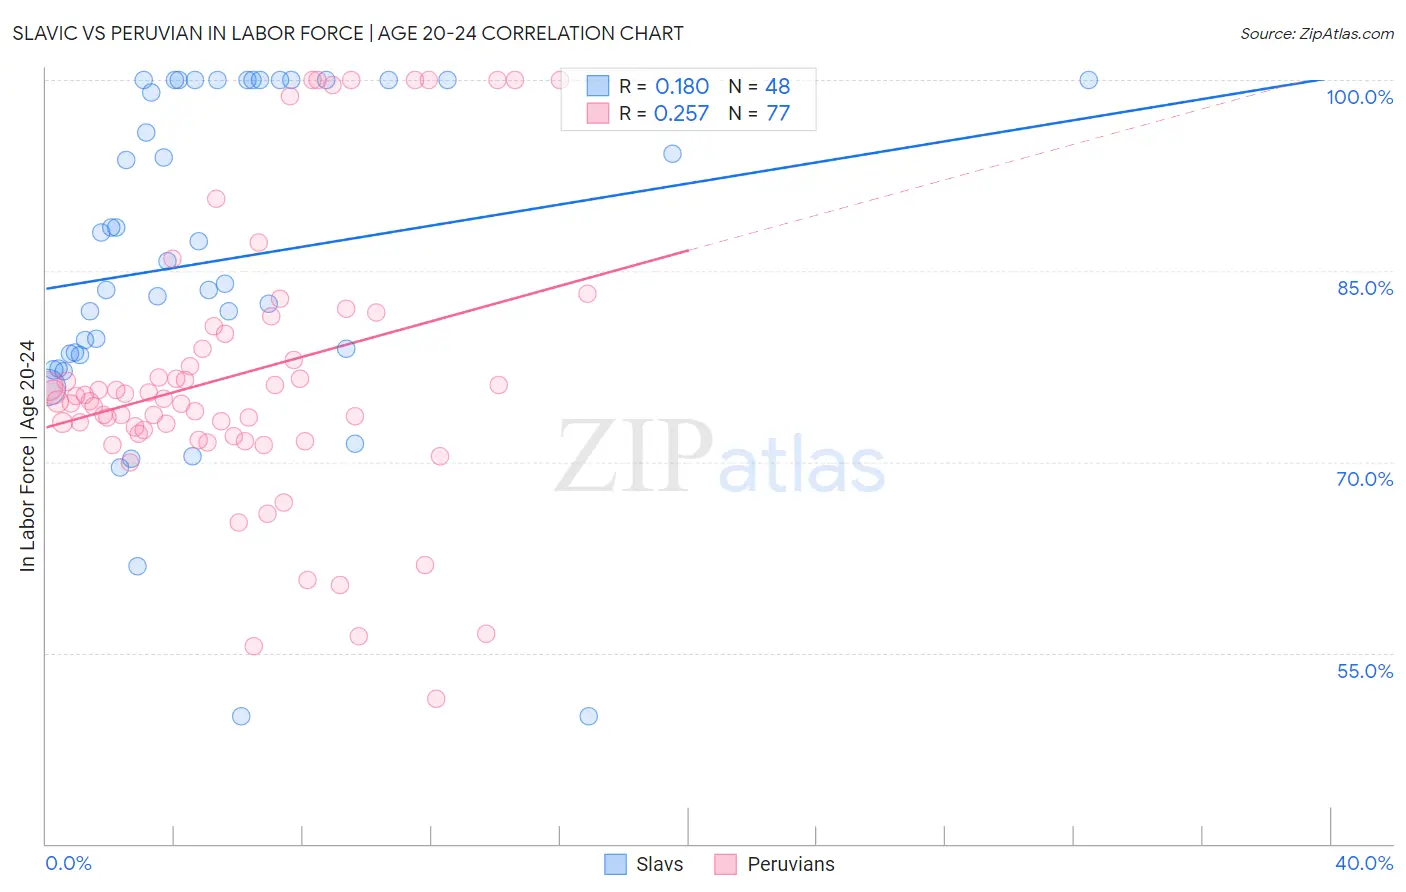
Slavic vs Peruvian In Labor Force | Age 20-24 Correlation Chart

The statistical analysis conducted on geographies consisting of 270,816,892 people shows a poor positive correlation between the proportion of Slavs and labor force participation rate among population between the ages 20 and 24 in the United States with a correlation coefficient (R) of 0.180 and weighted average of 76.9%. Similarly, the statistical analysis conducted on geographies consisting of 363,167,677 people shows a weak positive correlation between the proportion of Peruvians and labor force participation rate among population between the ages 20 and 24 in the United States with a correlation coefficient (R) of 0.257 and weighted average of 74.5%, a difference of 3.1%.
Slavic vs Peruvian In Labor Force | Age 20-24

In Labor Force | Age 20-24 Correlation Summary

MeasurementSlavicPeruvian
Minimum50.0%51.4%
Maximum100.0%100.0%
Range50.0%48.6%
Mean85.8%76.9%
Median84.9%74.9%
Interquartile 25% (IQ1)78.5%72.1%
Interquartile 75% (IQ3)100.0%80.3%
Interquartile Range (IQR)21.5%8.2%
Standard Deviation (Sample)13.1%11.1%
Standard Deviation (Population)13.0%11.1%

Similar Demographics by In Labor Force | Age 20-24

Demographics Similar to Slavs by In Labor Force | Age 20-24

In terms of in labor force | age 20-24, the demographic groups most similar to Slavs are Icelander (76.9%, a difference of 0.010%), Crow (76.9%, a difference of 0.020%), French American Indian (76.8%, a difference of 0.040%), Immigrants from Sudan (76.8%, a difference of 0.050%), and Ottawa (76.8%, a difference of 0.060%).
DemographicsRating | RankIn Labor Force | Age 20-24
Kenyans
99.9
/100
|
#60
Exceptional
77.0%
Immigrants | Eritrea
99.9
/100
|
#61
Exceptional
77.0%
Immigrants | Kenya
99.9
/100
|
#62
Exceptional
77.0%
Lithuanians
99.9
/100
|
#63
Exceptional
77.0%
Whites/Caucasians
99.9
/100
|
#64
Exceptional
76.9%
Crow
99.9
/100
|
#65
Exceptional
76.9%
Icelanders
99.9
/100
|
#66
Exceptional
76.9%
Slavs
99.9
/100
|
#67
Exceptional
76.9%
French American Indians
99.8
/100
|
#68
Exceptional
76.8%
Immigrants | Sudan
99.8
/100
|
#69
Exceptional
76.8%
Ottawa
99.8
/100
|
#70
Exceptional
76.8%
Northern Europeans
99.8
/100
|
#71
Exceptional
76.8%
Guamanians/Chamorros
99.8
/100
|
#72
Exceptional
76.7%
British
99.8
/100
|
#73
Exceptional
76.7%
Cree
99.7
/100
|
#74
Exceptional
76.6%

Demographics Similar to Peruvians by In Labor Force | Age 20-24

In terms of in labor force | age 20-24, the demographic groups most similar to Peruvians are Creek (74.5%, a difference of 0.0%), Immigrants from Southern Europe (74.5%, a difference of 0.0%), Immigrants from Ghana (74.5%, a difference of 0.020%), Immigrants from Kuwait (74.5%, a difference of 0.020%), and Chilean (74.5%, a difference of 0.030%).
DemographicsRating | RankIn Labor Force | Age 20-24
Sioux
17.5
/100
|
#206
Poor
74.6%
Albanians
16.2
/100
|
#207
Poor
74.6%
Immigrants | Uruguay
15.8
/100
|
#208
Poor
74.6%
Arabs
15.8
/100
|
#209
Poor
74.6%
Uruguayans
15.1
/100
|
#210
Poor
74.6%
Immigrants | Australia
14.7
/100
|
#211
Poor
74.6%
Creek
13.3
/100
|
#212
Poor
74.5%
Peruvians
13.3
/100
|
#213
Poor
74.5%
Immigrants | Southern Europe
13.2
/100
|
#214
Poor
74.5%
Immigrants | Ghana
12.7
/100
|
#215
Poor
74.5%
Immigrants | Kuwait
12.7
/100
|
#216
Poor
74.5%
Chileans
12.5
/100
|
#217
Poor
74.5%
Immigrants | Peru
10.6
/100
|
#218
Poor
74.5%
Nepalese
10.5
/100
|
#219
Poor
74.5%
Immigrants | Norway
10.3
/100
|
#220
Poor
74.5%