Slavic vs Immigrants from Philippines In Labor Force | Age 20-24

COMPARE

Slavic
Race
Ancestry
AfghanAfricanAlaska NativeAlaskan AthabascanAlbanianAleutAlsatianAmericanApacheArabArapahoArgentineanArmenianAssyrian/Chaldean/SyriacAustralianAustrianBahamianBangladeshiBarbadianBasqueBelgianBelizeanBermudanBhutaneseBlackfeetBolivianBrazilianBritishBritish West IndianBulgarianBurmeseCajunCambodianCanadianCape VerdeanCarpatho RusynCelticCentral AmericanCentral American IndianCherokeeCheyenneChickasawChileanChineseChippewaChoctawColombianColvilleComancheCosta RicanCreeCreekCroatianCrowCubanCypriotCzechCzechoslovakianDanishDelawareDominicanDutchDutch West IndianEastern EuropeanEcuadorianEgyptianEnglishEstonianEthiopianEuropeanFijianFilipinoFinnishFrenchFrench American IndianFrench CanadianGermanGerman RussianGhanaianGreekGuamanian/ChamorroGuatemalanGuyaneseHaitianHmongHonduranHopiHoumaHungarianIcelanderIndian (Asian)IndonesianInupiatIranianIraqiIrishIroquoisIsraeliItalianJamaicanJapaneseJordanianKenyanKiowaKoreanLaotianLatvianLebaneseLiberianLithuanianLumbeeLuxembourgerMacedonianMalaysianMalteseMarshalleseMenomineeMexicanMexican American IndianMongolianMoroccanNative HawaiianNavajoNepaleseNew ZealanderNicaraguanNigerianNorthern EuropeanNorwegianOkinawanOsageOttawaPaiutePakistaniPalestinianPanamanianParaguayanPennsylvania GermanPeruvianPimaPolishPortuguesePotawatomiPuebloPuerto RicanPuget Sound SalishRomanianRussianSalvadoranSamoanScandinavianScotch-IrishScottishSeminoleSenegaleseSerbianShoshoneSierra LeoneanSiouxSlavicSlovakSloveneSomaliSouth AfricanSouth AmericanSouth American IndianSoviet UnionSpaniardSpanishSpanish AmericanSpanish American IndianSri LankanSubsaharan AfricanSudaneseSwedishSwissSyrianTaiwaneseThaiTlingit-HaidaTohono O'OdhamTonganTrinidadian and TobagonianTsimshianTurkishU.S. Virgin IslanderUgandanUkrainianUruguayanUteVenezuelanVietnameseWelshWest IndianYakamaYaquiYugoslavianYumanYup'ikZimbabwean
Immigration
NonimmigrantsImmigrantsAfghanistanAfricaAlbaniaArgentinaArmeniaAsiaAustraliaAustriaBahamasBangladeshBarbadosBelarusBelgiumBelizeBoliviaBosnia and HerzegovinaBrazilBulgariaBurma/MyanmarCabo VerdeCambodiaCameroonCanadaCaribbeanCentral AmericaChileChinaColombiaCongoCosta RicaCroatiaCubaCzechoslovakiaDenmarkDominicaDominican RepublicEastern AfricaEastern AsiaEastern EuropeEcuadorEgyptEl SalvadorEnglandEritreaEthiopiaEuropeFijiFranceGermanyGhanaGreeceGrenadaGuatemalaGuyanaHaitiHondurasHong KongHungaryIndiaIndonesiaIranIraqIrelandIsraelItalyJamaicaJapanJordanKazakhstanKenyaKoreaKuwaitLaosLatin AmericaLatviaLebanonLiberiaLithuaniaMalaysiaMexicoMicronesiaMiddle AfricaMoldovaMoroccoNepalNetherlandsNicaraguaNigeriaNorth AmericaNorth MacedoniaNorthern AfricaNorthern EuropeNorwayOceaniaPakistanPanamaPeruPolandPortugalRomaniaRussiaSaudi ArabiaScotlandSenegalSerbiaSierra LeoneSingaporeSomaliaSouth AfricaSouth AmericaSouth Central AsiaSouth Eastern AsiaSouthern EuropeSpainSri LankaSt. Vincent and the GrenadinesSudanSwedenSwitzerlandSyriaTaiwanThailandTrinidad and TobagoTurkeyUgandaUkraineUruguayUzbekistanVenezuelaVietnamWest IndiesWestern AfricaWestern AsiaWestern EuropeYemenZaireZimbabweAzores
Immigrants from Philippines
Race
Ancestry
AfghanAfricanAlaska NativeAlaskan AthabascanAlbanianAleutAlsatianAmericanApacheArabArapahoArgentineanArmenianAssyrian/Chaldean/SyriacAustralianAustrianBahamianBangladeshiBarbadianBasqueBelgianBelizeanBermudanBhutaneseBlackfeetBolivianBrazilianBritishBritish West IndianBulgarianBurmeseCajunCambodianCanadianCape VerdeanCarpatho RusynCelticCentral AmericanCentral American IndianCherokeeCheyenneChickasawChileanChineseChippewaChoctawColombianColvilleComancheCosta RicanCreeCreekCroatianCrowCubanCypriotCzechCzechoslovakianDanishDelawareDominicanDutchDutch West IndianEastern EuropeanEcuadorianEgyptianEnglishEstonianEthiopianEuropeanFijianFilipinoFinnishFrenchFrench American IndianFrench CanadianGermanGerman RussianGhanaianGreekGuamanian/ChamorroGuatemalanGuyaneseHaitianHmongHonduranHopiHoumaHungarianIcelanderIndian (Asian)IndonesianInupiatIranianIraqiIrishIroquoisIsraeliItalianJamaicanJapaneseJordanianKenyanKiowaKoreanLaotianLatvianLebaneseLiberianLithuanianLumbeeLuxembourgerMacedonianMalaysianMalteseMarshalleseMenomineeMexicanMexican American IndianMongolianMoroccanNative HawaiianNavajoNepaleseNew ZealanderNicaraguanNigerianNorthern EuropeanNorwegianOkinawanOsageOttawaPaiutePakistaniPalestinianPanamanianParaguayanPennsylvania GermanPeruvianPimaPolishPortuguesePotawatomiPuebloPuerto RicanPuget Sound SalishRomanianRussianSalvadoranSamoanScandinavianScotch-IrishScottishSeminoleSenegaleseSerbianShoshoneSierra LeoneanSiouxSlovakSloveneSomaliSouth AfricanSouth AmericanSouth American IndianSoviet UnionSpaniardSpanishSpanish AmericanSpanish American IndianSri LankanSubsaharan AfricanSudaneseSwedishSwissSyrianTaiwaneseThaiTlingit-HaidaTohono O'OdhamTonganTrinidadian and TobagonianTsimshianTurkishU.S. Virgin IslanderUgandanUkrainianUruguayanUteVenezuelanVietnameseWelshWest IndianYakamaYaquiYugoslavianYumanYup'ikZimbabwean
Immigration
NonimmigrantsImmigrantsAfghanistanAfricaAlbaniaArgentinaArmeniaAsiaAustraliaAustriaBahamasBangladeshBarbadosBelarusBelgiumBelizeBoliviaBosnia and HerzegovinaBrazilBulgariaBurma/MyanmarCabo VerdeCambodiaCameroonCanadaCaribbeanCentral AmericaChileChinaColombiaCongoCosta RicaCroatiaCubaCzechoslovakiaDenmarkDominicaDominican RepublicEastern AfricaEastern AsiaEastern EuropeEcuadorEgyptEl SalvadorEnglandEritreaEthiopiaEuropeFijiFranceGermanyGhanaGreeceGrenadaGuatemalaGuyanaHaitiHondurasHong KongHungaryIndiaIndonesiaIranIraqIrelandIsraelItalyJamaicaJapanJordanKazakhstanKenyaKoreaKuwaitLaosLatin AmericaLatviaLebanonLiberiaLithuaniaMalaysiaMexicoMicronesiaMiddle AfricaMoldovaMoroccoNepalNetherlandsNicaraguaNigeriaNorth AmericaNorth MacedoniaNorthern AfricaNorthern EuropeNorwayOceaniaPakistanPanamaPeruPhilippinesPolandPortugalRomaniaRussiaSaudi ArabiaScotlandSenegalSerbiaSierra LeoneSingaporeSomaliaSouth AfricaSouth AmericaSouth Central AsiaSouth Eastern AsiaSouthern EuropeSpainSri LankaSt. Vincent and the GrenadinesSudanSwedenSwitzerlandSyriaTaiwanThailandTrinidad and TobagoTurkeyUgandaUkraineUruguayUzbekistanVenezuelaVietnamWest IndiesWestern AfricaWestern AsiaWestern EuropeYemenZaireZimbabweAzores
In Labor Force | Age 20-24
Income
Poverty
Unemployment
Labor Participation
Family Structure
Vehicle Availability
Education Level
Disability

In Labor Force | Age 20-24 Comparison

Slavs

Immigrants from Philippines

Exceptional
Average
76.9%
IN LABOR FORCE | AGE 20-24
99.9/ 100
METRIC RATING
67th/ 347
METRIC RANK
75.1%
IN LABOR FORCE | AGE 20-24
55.8/ 100
METRIC RATING
169th/ 347
METRIC RANK

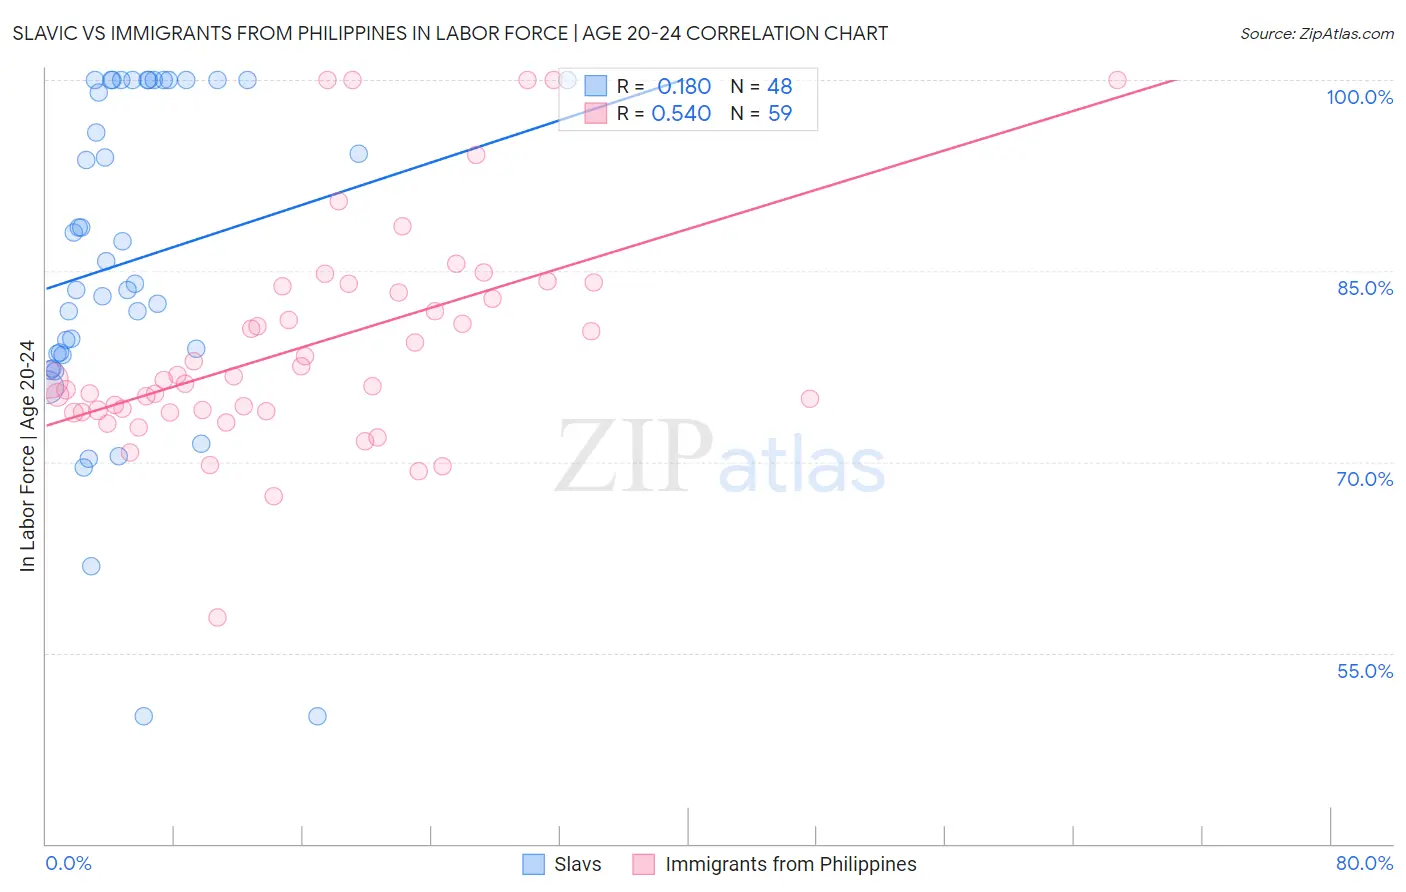
Slavic vs Immigrants from Philippines In Labor Force | Age 20-24 Correlation Chart

The statistical analysis conducted on geographies consisting of 270,816,892 people shows a poor positive correlation between the proportion of Slavs and labor force participation rate among population between the ages 20 and 24 in the United States with a correlation coefficient (R) of 0.180 and weighted average of 76.9%. Similarly, the statistical analysis conducted on geographies consisting of 470,994,920 people shows a substantial positive correlation between the proportion of Immigrants from Philippines and labor force participation rate among population between the ages 20 and 24 in the United States with a correlation coefficient (R) of 0.540 and weighted average of 75.1%, a difference of 2.3%.
Slavic vs Immigrants from Philippines In Labor Force | Age 20-24

In Labor Force | Age 20-24 Correlation Summary

MeasurementSlavicImmigrants from Philippines
Minimum50.0%57.8%
Maximum100.0%100.0%
Range50.0%42.2%
Mean85.8%79.2%
Median84.9%76.5%
Interquartile 25% (IQ1)78.5%74.0%
Interquartile 75% (IQ3)100.0%83.8%
Interquartile Range (IQR)21.5%9.8%
Standard Deviation (Sample)13.1%8.7%
Standard Deviation (Population)13.0%8.6%

Similar Demographics by In Labor Force | Age 20-24

Demographics Similar to Slavs by In Labor Force | Age 20-24

In terms of in labor force | age 20-24, the demographic groups most similar to Slavs are Icelander (76.9%, a difference of 0.010%), Crow (76.9%, a difference of 0.020%), French American Indian (76.8%, a difference of 0.040%), Immigrants from Sudan (76.8%, a difference of 0.050%), and Ottawa (76.8%, a difference of 0.060%).
DemographicsRating | RankIn Labor Force | Age 20-24
Kenyans
99.9
/100
|
#60
Exceptional
77.0%
Immigrants | Eritrea
99.9
/100
|
#61
Exceptional
77.0%
Immigrants | Kenya
99.9
/100
|
#62
Exceptional
77.0%
Lithuanians
99.9
/100
|
#63
Exceptional
77.0%
Whites/Caucasians
99.9
/100
|
#64
Exceptional
76.9%
Crow
99.9
/100
|
#65
Exceptional
76.9%
Icelanders
99.9
/100
|
#66
Exceptional
76.9%
Slavs
99.9
/100
|
#67
Exceptional
76.9%
French American Indians
99.8
/100
|
#68
Exceptional
76.8%
Immigrants | Sudan
99.8
/100
|
#69
Exceptional
76.8%
Ottawa
99.8
/100
|
#70
Exceptional
76.8%
Northern Europeans
99.8
/100
|
#71
Exceptional
76.8%
Guamanians/Chamorros
99.8
/100
|
#72
Exceptional
76.7%
British
99.8
/100
|
#73
Exceptional
76.7%
Cree
99.7
/100
|
#74
Exceptional
76.6%

Demographics Similar to Immigrants from Philippines by In Labor Force | Age 20-24

In terms of in labor force | age 20-24, the demographic groups most similar to Immigrants from Philippines are Immigrants from Western Africa (75.1%, a difference of 0.010%), Immigrants from South Eastern Asia (75.1%, a difference of 0.030%), Mexican (75.1%, a difference of 0.050%), Cambodian (75.2%, a difference of 0.070%), and Cajun (75.1%, a difference of 0.070%).
DemographicsRating | RankIn Labor Force | Age 20-24
Immigrants | Romania
64.6
/100
|
#162
Good
75.2%
Costa Ricans
64.2
/100
|
#163
Good
75.2%
Bolivians
64.0
/100
|
#164
Good
75.2%
Afghans
63.5
/100
|
#165
Good
75.2%
Cambodians
60.5
/100
|
#166
Good
75.2%
Immigrants | South Eastern Asia
57.5
/100
|
#167
Average
75.1%
Immigrants | Western Africa
56.7
/100
|
#168
Average
75.1%
Immigrants | Philippines
55.8
/100
|
#169
Average
75.1%
Mexicans
52.1
/100
|
#170
Average
75.1%
Cajuns
51.1
/100
|
#171
Average
75.1%
Yakama
50.8
/100
|
#172
Average
75.1%
Immigrants | Croatia
50.2
/100
|
#173
Average
75.1%
South Africans
50.0
/100
|
#174
Average
75.0%
Syrians
49.5
/100
|
#175
Average
75.0%
Central Americans
48.7
/100
|
#176
Average
75.0%