Sioux vs Ottawa In Labor Force | Age 25-29
COMPARE
Sioux
Ottawa
In Labor Force | Age 25-29
In Labor Force | Age 25-29 Comparison
Sioux
Ottawa
79.7%
IN LABOR FORCE | AGE 25-29
0.0/ 100
METRIC RATING
333rd/ 347
METRIC RANK
83.0%
IN LABOR FORCE | AGE 25-29
0.0/ 100
METRIC RATING
288th/ 347
METRIC RANK
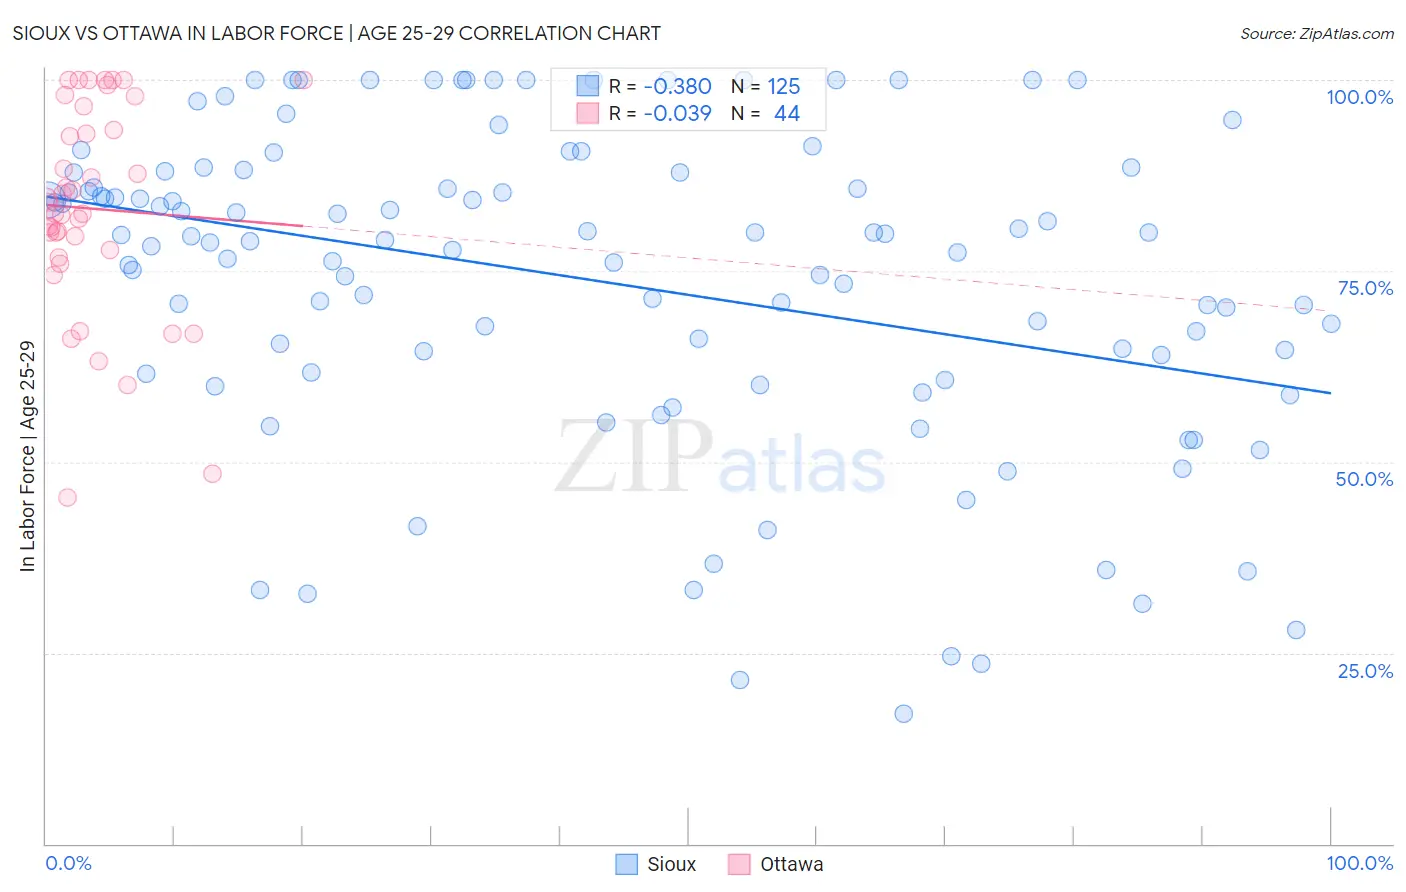
Sioux vs Ottawa In Labor Force | Age 25-29 Correlation Chart
The statistical analysis conducted on geographies consisting of 234,111,453 people shows a mild negative correlation between the proportion of Sioux and labor force participation rate among population between the ages 25 and 29 in the United States with a correlation coefficient (R) of -0.380 and weighted average of 79.7%. Similarly, the statistical analysis conducted on geographies consisting of 49,951,739 people shows no correlation between the proportion of Ottawa and labor force participation rate among population between the ages 25 and 29 in the United States with a correlation coefficient (R) of -0.039 and weighted average of 83.0%, a difference of 4.2%.
In Labor Force | Age 25-29 Correlation Summary
| Measurement | Sioux | Ottawa |
| Minimum | 17.0% | 45.3% |
| Maximum | 100.0% | 100.0% |
| Range | 83.0% | 54.7% |
| Mean | 73.7% | 83.2% |
| Median | 78.9% | 83.3% |
| Interquartile 25% (IQ1) | 61.6% | 77.3% |
| Interquartile 75% (IQ3) | 87.9% | 95.0% |
| Interquartile Range (IQR) | 26.3% | 17.7% |
| Standard Deviation (Sample) | 20.5% | 13.8% |
| Standard Deviation (Population) | 20.4% | 13.6% |
Similar Demographics by In Labor Force | Age 25-29
Demographics Similar to Sioux by In Labor Force | Age 25-29
In terms of in labor force | age 25-29, the demographic groups most similar to Sioux are Inupiat (79.8%, a difference of 0.11%), Yuman (79.3%, a difference of 0.42%), Native/Alaskan (79.3%, a difference of 0.50%), Apache (79.2%, a difference of 0.57%), and Cheyenne (80.3%, a difference of 0.80%).
| Demographics | Rating | Rank | In Labor Force | Age 25-29 |
| Choctaw | 0.0 /100 | #326 | Tragic 81.0% |
| Ute | 0.0 /100 | #327 | Tragic 80.8% |
| Creek | 0.0 /100 | #328 | Tragic 80.7% |
| Yakama | 0.0 /100 | #329 | Tragic 80.6% |
| Puerto Ricans | 0.0 /100 | #330 | Tragic 80.4% |
| Cheyenne | 0.0 /100 | #331 | Tragic 80.3% |
| Inupiat | 0.0 /100 | #332 | Tragic 79.8% |
| Sioux | 0.0 /100 | #333 | Tragic 79.7% |
| Yuman | 0.0 /100 | #334 | Tragic 79.3% |
| Natives/Alaskans | 0.0 /100 | #335 | Tragic 79.3% |
| Apache | 0.0 /100 | #336 | Tragic 79.2% |
| Crow | 0.0 /100 | #337 | Tragic 78.6% |
| Lumbee | 0.0 /100 | #338 | Tragic 78.3% |
| Immigrants | Yemen | 0.0 /100 | #339 | Tragic 78.2% |
| Paiute | 0.0 /100 | #340 | Tragic 78.1% |
Demographics Similar to Ottawa by In Labor Force | Age 25-29
In terms of in labor force | age 25-29, the demographic groups most similar to Ottawa are Immigrants from Micronesia (83.0%, a difference of 0.020%), Guyanese (83.0%, a difference of 0.030%), Mexican American Indian (83.0%, a difference of 0.040%), Immigrants from Bangladesh (83.0%, a difference of 0.050%), and Belizean (83.1%, a difference of 0.060%).
| Demographics | Rating | Rank | In Labor Force | Age 25-29 |
| Immigrants | Dominican Republic | 0.0 /100 | #281 | Tragic 83.1% |
| Americans | 0.0 /100 | #282 | Tragic 83.1% |
| Immigrants | Azores | 0.0 /100 | #283 | Tragic 83.1% |
| Nicaraguans | 0.0 /100 | #284 | Tragic 83.1% |
| Belizeans | 0.0 /100 | #285 | Tragic 83.1% |
| Mexican American Indians | 0.0 /100 | #286 | Tragic 83.0% |
| Guyanese | 0.0 /100 | #287 | Tragic 83.0% |
| Ottawa | 0.0 /100 | #288 | Tragic 83.0% |
| Immigrants | Micronesia | 0.0 /100 | #289 | Tragic 83.0% |
| Immigrants | Bangladesh | 0.0 /100 | #290 | Tragic 83.0% |
| Hawaiians | 0.0 /100 | #291 | Tragic 83.0% |
| Immigrants | Guyana | 0.0 /100 | #292 | Tragic 83.0% |
| Immigrants | Latin America | 0.0 /100 | #293 | Tragic 82.9% |
| Nepalese | 0.0 /100 | #294 | Tragic 82.9% |
| Chippewa | 0.0 /100 | #295 | Tragic 82.9% |