Serbian vs French In Labor Force | Age 20-64

COMPARE

Serbian
Race
Ancestry
AfghanAfricanAlaska NativeAlaskan AthabascanAlbanianAleutAlsatianAmericanApacheArabArapahoArgentineanArmenianAssyrian/Chaldean/SyriacAustralianAustrianBahamianBangladeshiBarbadianBasqueBelgianBelizeanBermudanBhutaneseBlackfeetBolivianBrazilianBritishBritish West IndianBulgarianBurmeseCajunCambodianCanadianCape VerdeanCarpatho RusynCelticCentral AmericanCentral American IndianCherokeeCheyenneChickasawChileanChineseChippewaChoctawColombianColvilleComancheCosta RicanCreeCreekCroatianCrowCubanCypriotCzechCzechoslovakianDanishDelawareDominicanDutchDutch West IndianEastern EuropeanEcuadorianEgyptianEnglishEstonianEthiopianEuropeanFijianFilipinoFinnishFrench American IndianFrench CanadianGermanGerman RussianGhanaianGreekGuamanian/ChamorroGuatemalanGuyaneseHaitianHmongHonduranHopiHoumaHungarianIcelanderIndian (Asian)IndonesianInupiatIranianIraqiIrishIroquoisIsraeliItalianJamaicanJapaneseJordanianKenyanKiowaKoreanLaotianLatvianLebaneseLiberianLithuanianLumbeeLuxembourgerMacedonianMalaysianMalteseMarshalleseMenomineeMexicanMexican American IndianMongolianMoroccanNative HawaiianNavajoNepaleseNew ZealanderNicaraguanNigerianNorthern EuropeanNorwegianOkinawanOsageOttawaPaiutePakistaniPalestinianPanamanianParaguayanPennsylvania GermanPeruvianPimaPolishPortuguesePotawatomiPuebloPuerto RicanPuget Sound SalishRomanianRussianSalvadoranSamoanScandinavianScotch-IrishScottishSeminoleSenegaleseSerbianShoshoneSierra LeoneanSiouxSlavicSlovakSloveneSomaliSouth AfricanSouth AmericanSouth American IndianSoviet UnionSpaniardSpanishSpanish AmericanSpanish American IndianSri LankanSubsaharan AfricanSudaneseSwedishSwissSyrianTaiwaneseThaiTlingit-HaidaTohono O'OdhamTonganTrinidadian and TobagonianTsimshianTurkishU.S. Virgin IslanderUgandanUkrainianUruguayanUteVenezuelanVietnameseWelshWest IndianYakamaYaquiYugoslavianYumanYup'ikZimbabwean
Immigration
NonimmigrantsImmigrantsAfghanistanAfricaAlbaniaArgentinaArmeniaAsiaAustraliaAustriaBahamasBangladeshBarbadosBelarusBelgiumBelizeBoliviaBosnia and HerzegovinaBrazilBulgariaBurma/MyanmarCabo VerdeCambodiaCameroonCanadaCaribbeanCentral AmericaChileChinaColombiaCongoCosta RicaCroatiaCubaCzechoslovakiaDenmarkDominicaDominican RepublicEastern AfricaEastern AsiaEastern EuropeEcuadorEgyptEl SalvadorEnglandEritreaEthiopiaEuropeFijiFranceGermanyGhanaGreeceGrenadaGuatemalaGuyanaHaitiHondurasHong KongHungaryIndiaIndonesiaIranIraqIrelandIsraelItalyJamaicaJapanJordanKazakhstanKenyaKoreaKuwaitLaosLatin AmericaLatviaLebanonLiberiaLithuaniaMalaysiaMexicoMicronesiaMiddle AfricaMoldovaMoroccoNepalNetherlandsNicaraguaNigeriaNorth AmericaNorth MacedoniaNorthern AfricaNorthern EuropeNorwayOceaniaPakistanPanamaPeruPhilippinesPolandPortugalRomaniaRussiaSaudi ArabiaScotlandSenegalSerbiaSierra LeoneSingaporeSomaliaSouth AfricaSouth AmericaSouth Central AsiaSouth Eastern AsiaSouthern EuropeSpainSri LankaSt. Vincent and the GrenadinesSudanSwedenSwitzerlandSyriaTaiwanThailandTrinidad and TobagoTurkeyUgandaUkraineUruguayUzbekistanVenezuelaVietnamWest IndiesWestern AfricaWestern AsiaWestern EuropeYemenZaireZimbabweAzores
French
Race
Ancestry
AfghanAfricanAlaska NativeAlaskan AthabascanAlbanianAleutAlsatianAmericanApacheArabArapahoArgentineanArmenianAssyrian/Chaldean/SyriacAustralianAustrianBahamianBangladeshiBarbadianBasqueBelgianBelizeanBermudanBhutaneseBlackfeetBolivianBrazilianBritishBritish West IndianBulgarianBurmeseCajunCambodianCanadianCape VerdeanCarpatho RusynCelticCentral AmericanCentral American IndianCherokeeCheyenneChickasawChileanChineseChippewaChoctawColombianColvilleComancheCosta RicanCreeCreekCroatianCrowCubanCypriotCzechCzechoslovakianDanishDelawareDominicanDutchDutch West IndianEastern EuropeanEcuadorianEgyptianEnglishEstonianEthiopianEuropeanFijianFilipinoFinnishFrenchFrench American IndianFrench CanadianGermanGerman RussianGhanaianGreekGuamanian/ChamorroGuatemalanGuyaneseHaitianHmongHonduranHopiHoumaHungarianIcelanderIndian (Asian)IndonesianInupiatIranianIraqiIrishIroquoisIsraeliItalianJamaicanJapaneseJordanianKenyanKiowaKoreanLaotianLatvianLebaneseLiberianLithuanianLumbeeLuxembourgerMacedonianMalaysianMalteseMarshalleseMenomineeMexicanMexican American IndianMongolianMoroccanNative HawaiianNavajoNepaleseNew ZealanderNicaraguanNigerianNorthern EuropeanNorwegianOkinawanOsageOttawaPaiutePakistaniPalestinianPanamanianParaguayanPennsylvania GermanPeruvianPimaPolishPortuguesePotawatomiPuebloPuerto RicanPuget Sound SalishRomanianRussianSalvadoranSamoanScandinavianScotch-IrishScottishSeminoleSenegaleseShoshoneSierra LeoneanSiouxSlavicSlovakSloveneSomaliSouth AfricanSouth AmericanSouth American IndianSoviet UnionSpaniardSpanishSpanish AmericanSpanish American IndianSri LankanSubsaharan AfricanSudaneseSwedishSwissSyrianTaiwaneseThaiTlingit-HaidaTohono O'OdhamTonganTrinidadian and TobagonianTsimshianTurkishU.S. Virgin IslanderUgandanUkrainianUruguayanUteVenezuelanVietnameseWelshWest IndianYakamaYaquiYugoslavianYumanYup'ikZimbabwean
Immigration
NonimmigrantsImmigrantsAfghanistanAfricaAlbaniaArgentinaArmeniaAsiaAustraliaAustriaBahamasBangladeshBarbadosBelarusBelgiumBelizeBoliviaBosnia and HerzegovinaBrazilBulgariaBurma/MyanmarCabo VerdeCambodiaCameroonCanadaCaribbeanCentral AmericaChileChinaColombiaCongoCosta RicaCroatiaCubaCzechoslovakiaDenmarkDominicaDominican RepublicEastern AfricaEastern AsiaEastern EuropeEcuadorEgyptEl SalvadorEnglandEritreaEthiopiaEuropeFijiFranceGermanyGhanaGreeceGrenadaGuatemalaGuyanaHaitiHondurasHong KongHungaryIndiaIndonesiaIranIraqIrelandIsraelItalyJamaicaJapanJordanKazakhstanKenyaKoreaKuwaitLaosLatin AmericaLatviaLebanonLiberiaLithuaniaMalaysiaMexicoMicronesiaMiddle AfricaMoldovaMoroccoNepalNetherlandsNicaraguaNigeriaNorth AmericaNorth MacedoniaNorthern AfricaNorthern EuropeNorwayOceaniaPakistanPanamaPeruPhilippinesPolandPortugalRomaniaRussiaSaudi ArabiaScotlandSenegalSerbiaSierra LeoneSingaporeSomaliaSouth AfricaSouth AmericaSouth Central AsiaSouth Eastern AsiaSouthern EuropeSpainSri LankaSt. Vincent and the GrenadinesSudanSwedenSwitzerlandSyriaTaiwanThailandTrinidad and TobagoTurkeyUgandaUkraineUruguayUzbekistanVenezuelaVietnamWest IndiesWestern AfricaWestern AsiaWestern EuropeYemenZaireZimbabweAzores
In Labor Force | Age 20-64
Income
Poverty
Unemployment
Labor Participation
Family Structure
Vehicle Availability
Education Level
Disability

In Labor Force | Age 20-64 Comparison

Serbians

French

Exceptional
Tragic
80.3%
IN LABOR FORCE | AGE 20-64
98.9/ 100
METRIC RATING
58th/ 347
METRIC RANK
78.9%
IN LABOR FORCE | AGE 20-64
1.5/ 100
METRIC RATING
244th/ 347
METRIC RANK

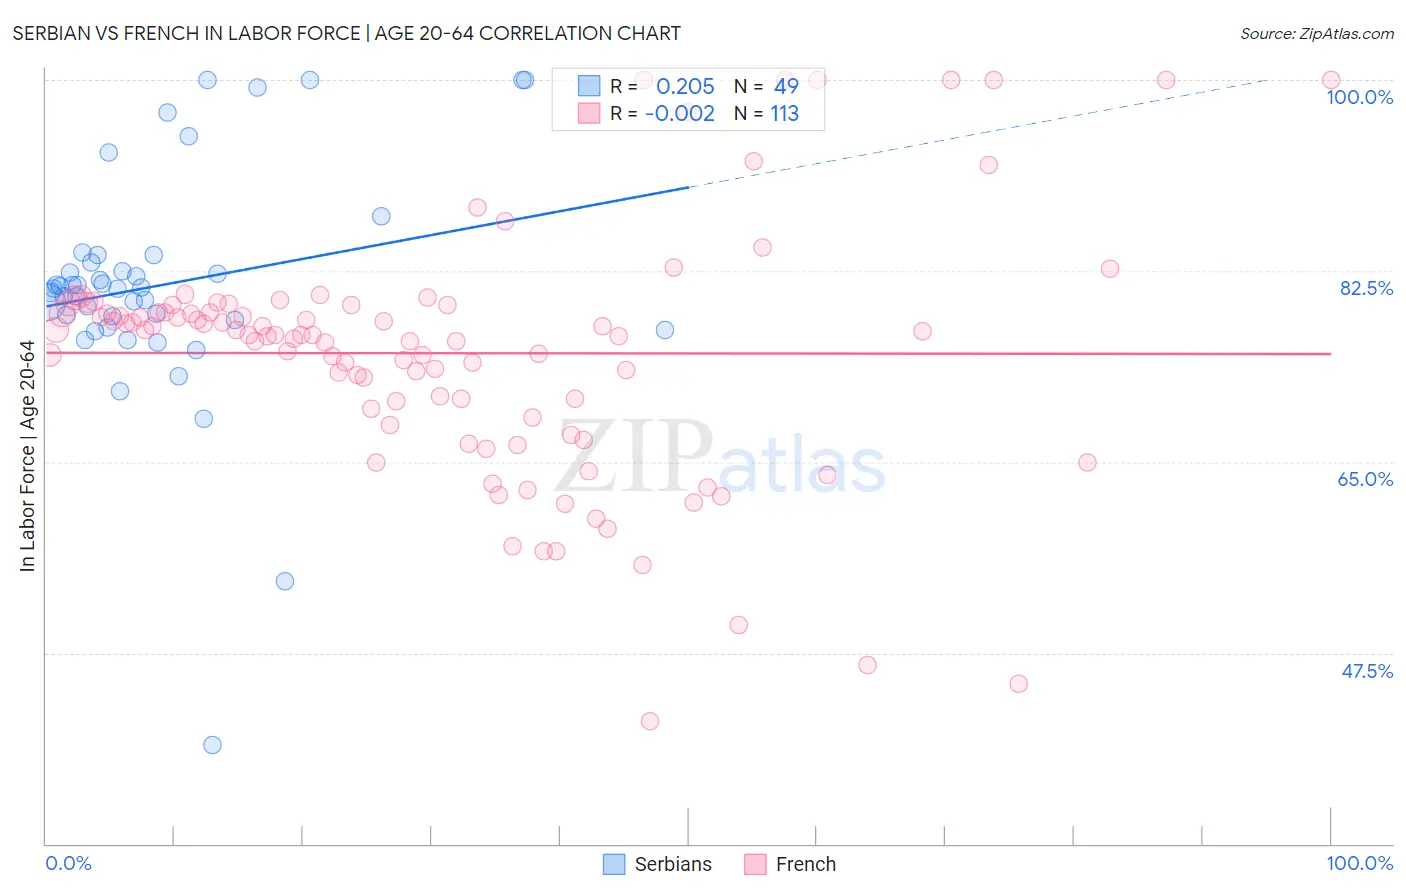
Serbian vs French In Labor Force | Age 20-64 Correlation Chart

The statistical analysis conducted on geographies consisting of 267,654,798 people shows a weak positive correlation between the proportion of Serbians and labor force participation rate among population between the ages 20 and 64 in the United States with a correlation coefficient (R) of 0.205 and weighted average of 80.3%. Similarly, the statistical analysis conducted on geographies consisting of 572,422,733 people shows no correlation between the proportion of French and labor force participation rate among population between the ages 20 and 64 in the United States with a correlation coefficient (R) of -0.002 and weighted average of 78.9%, a difference of 1.8%.
Serbian vs French In Labor Force | Age 20-64

In Labor Force | Age 20-64 Correlation Summary

MeasurementSerbianFrench
Minimum39.1%41.2%
Maximum100.0%100.0%
Range60.9%58.8%
Mean81.2%75.0%
Median80.9%76.6%
Interquartile 25% (IQ1)77.7%69.5%
Interquartile 75% (IQ3)83.6%79.3%
Interquartile Range (IQR)6.0%9.9%
Standard Deviation (Sample)10.6%11.2%
Standard Deviation (Population)10.5%11.2%

Similar Demographics by In Labor Force | Age 20-64

Demographics Similar to Serbians by In Labor Force | Age 20-64

In terms of in labor force | age 20-64, the demographic groups most similar to Serbians are Swedish (80.3%, a difference of 0.0%), Immigrants from Northern Africa (80.3%, a difference of 0.010%), Afghan (80.3%, a difference of 0.010%), Tongan (80.3%, a difference of 0.010%), and Burmese (80.3%, a difference of 0.010%).
DemographicsRating | RankIn Labor Force | Age 20-64
Immigrants | Sri Lanka
99.3
/100
|
#51
Exceptional
80.4%
Turks
99.2
/100
|
#52
Exceptional
80.3%
Immigrants | Peru
99.2
/100
|
#53
Exceptional
80.3%
Peruvians
99.1
/100
|
#54
Exceptional
80.3%
Immigrants | Cabo Verde
99.0
/100
|
#55
Exceptional
80.3%
Immigrants | Northern Africa
99.0
/100
|
#56
Exceptional
80.3%
Afghans
98.9
/100
|
#57
Exceptional
80.3%
Serbians
98.9
/100
|
#58
Exceptional
80.3%
Swedes
98.9
/100
|
#59
Exceptional
80.3%
Tongans
98.8
/100
|
#60
Exceptional
80.3%
Burmese
98.8
/100
|
#61
Exceptional
80.3%
Carpatho Rusyns
98.8
/100
|
#62
Exceptional
80.3%
Immigrants | Korea
98.8
/100
|
#63
Exceptional
80.3%
Immigrants | Albania
98.7
/100
|
#64
Exceptional
80.3%
Lithuanians
98.7
/100
|
#65
Exceptional
80.2%

Demographics Similar to French by In Labor Force | Age 20-64

In terms of in labor force | age 20-64, the demographic groups most similar to French are Immigrants from West Indies (78.9%, a difference of 0.030%), Scottish (78.9%, a difference of 0.040%), Immigrants from Micronesia (78.9%, a difference of 0.050%), Jamaican (78.9%, a difference of 0.060%), and Immigrants from Trinidad and Tobago (78.8%, a difference of 0.060%).
DemographicsRating | RankIn Labor Force | Age 20-64
Immigrants | North America
2.9
/100
|
#237
Tragic
79.0%
Immigrants | Jamaica
2.6
/100
|
#238
Tragic
79.0%
Welsh
2.4
/100
|
#239
Tragic
79.0%
Trinidadians and Tobagonians
2.3
/100
|
#240
Tragic
79.0%
Jamaicans
2.0
/100
|
#241
Tragic
78.9%
Immigrants | Micronesia
1.9
/100
|
#242
Tragic
78.9%
Immigrants | West Indies
1.7
/100
|
#243
Tragic
78.9%
French
1.5
/100
|
#244
Tragic
78.9%
Scottish
1.3
/100
|
#245
Tragic
78.9%
Immigrants | Trinidad and Tobago
1.1
/100
|
#246
Tragic
78.8%
Immigrants | Germany
1.0
/100
|
#247
Tragic
78.8%
Immigrants | Caribbean
1.0
/100
|
#248
Tragic
78.8%
English
0.9
/100
|
#249
Tragic
78.8%
Hondurans
0.8
/100
|
#250
Tragic
78.8%
Barbadians
0.7
/100
|
#251
Tragic
78.8%