Immigrants from Nepal vs French In Labor Force | Age 20-64

COMPARE

Immigrants from Nepal
Race
Ancestry
AfghanAfricanAlaska NativeAlaskan AthabascanAlbanianAleutAlsatianAmericanApacheArabArapahoArgentineanArmenianAssyrian/Chaldean/SyriacAustralianAustrianBahamianBangladeshiBarbadianBasqueBelgianBelizeanBermudanBhutaneseBlackfeetBolivianBrazilianBritishBritish West IndianBulgarianBurmeseCajunCambodianCanadianCape VerdeanCarpatho RusynCelticCentral AmericanCentral American IndianCherokeeCheyenneChickasawChileanChineseChippewaChoctawColombianColvilleComancheCosta RicanCreeCreekCroatianCrowCubanCypriotCzechCzechoslovakianDanishDelawareDominicanDutchDutch West IndianEastern EuropeanEcuadorianEgyptianEnglishEstonianEthiopianEuropeanFijianFilipinoFinnishFrench American IndianFrench CanadianGermanGerman RussianGhanaianGreekGuamanian/ChamorroGuatemalanGuyaneseHaitianHmongHonduranHopiHoumaHungarianIcelanderIndian (Asian)IndonesianInupiatIranianIraqiIrishIroquoisIsraeliItalianJamaicanJapaneseJordanianKenyanKiowaKoreanLaotianLatvianLebaneseLiberianLithuanianLumbeeLuxembourgerMacedonianMalaysianMalteseMarshalleseMenomineeMexicanMexican American IndianMongolianMoroccanNative HawaiianNavajoNepaleseNew ZealanderNicaraguanNigerianNorthern EuropeanNorwegianOkinawanOsageOttawaPaiutePakistaniPalestinianPanamanianParaguayanPennsylvania GermanPeruvianPimaPolishPortuguesePotawatomiPuebloPuerto RicanPuget Sound SalishRomanianRussianSalvadoranSamoanScandinavianScotch-IrishScottishSeminoleSenegaleseSerbianShoshoneSierra LeoneanSiouxSlavicSlovakSloveneSomaliSouth AfricanSouth AmericanSouth American IndianSoviet UnionSpaniardSpanishSpanish AmericanSpanish American IndianSri LankanSubsaharan AfricanSudaneseSwedishSwissSyrianTaiwaneseThaiTlingit-HaidaTohono O'OdhamTonganTrinidadian and TobagonianTsimshianTurkishU.S. Virgin IslanderUgandanUkrainianUruguayanUteVenezuelanVietnameseWelshWest IndianYakamaYaquiYugoslavianYumanYup'ikZimbabwean
Immigration
NonimmigrantsImmigrantsAfghanistanAfricaAlbaniaArgentinaArmeniaAsiaAustraliaAustriaBahamasBangladeshBarbadosBelarusBelgiumBelizeBoliviaBosnia and HerzegovinaBrazilBulgariaBurma/MyanmarCabo VerdeCambodiaCameroonCanadaCaribbeanCentral AmericaChileChinaColombiaCongoCosta RicaCroatiaCubaCzechoslovakiaDenmarkDominicaDominican RepublicEastern AfricaEastern AsiaEastern EuropeEcuadorEgyptEl SalvadorEnglandEritreaEthiopiaEuropeFijiFranceGermanyGhanaGreeceGrenadaGuatemalaGuyanaHaitiHondurasHong KongHungaryIndiaIndonesiaIranIraqIrelandIsraelItalyJamaicaJapanJordanKazakhstanKenyaKoreaKuwaitLaosLatin AmericaLatviaLebanonLiberiaLithuaniaMalaysiaMexicoMicronesiaMiddle AfricaMoldovaMoroccoNepalNetherlandsNicaraguaNigeriaNorth AmericaNorth MacedoniaNorthern AfricaNorthern EuropeNorwayOceaniaPakistanPanamaPeruPhilippinesPolandPortugalRomaniaRussiaSaudi ArabiaScotlandSenegalSerbiaSierra LeoneSingaporeSomaliaSouth AfricaSouth AmericaSouth Central AsiaSouth Eastern AsiaSouthern EuropeSpainSri LankaSt. Vincent and the GrenadinesSudanSwedenSwitzerlandSyriaTaiwanThailandTrinidad and TobagoTurkeyUgandaUkraineUruguayUzbekistanVenezuelaVietnamWest IndiesWestern AfricaWestern AsiaWestern EuropeYemenZaireZimbabweAzores
French
Race
Ancestry
AfghanAfricanAlaska NativeAlaskan AthabascanAlbanianAleutAlsatianAmericanApacheArabArapahoArgentineanArmenianAssyrian/Chaldean/SyriacAustralianAustrianBahamianBangladeshiBarbadianBasqueBelgianBelizeanBermudanBhutaneseBlackfeetBolivianBrazilianBritishBritish West IndianBulgarianBurmeseCajunCambodianCanadianCape VerdeanCarpatho RusynCelticCentral AmericanCentral American IndianCherokeeCheyenneChickasawChileanChineseChippewaChoctawColombianColvilleComancheCosta RicanCreeCreekCroatianCrowCubanCypriotCzechCzechoslovakianDanishDelawareDominicanDutchDutch West IndianEastern EuropeanEcuadorianEgyptianEnglishEstonianEthiopianEuropeanFijianFilipinoFinnishFrenchFrench American IndianFrench CanadianGermanGerman RussianGhanaianGreekGuamanian/ChamorroGuatemalanGuyaneseHaitianHmongHonduranHopiHoumaHungarianIcelanderIndian (Asian)IndonesianInupiatIranianIraqiIrishIroquoisIsraeliItalianJamaicanJapaneseJordanianKenyanKiowaKoreanLaotianLatvianLebaneseLiberianLithuanianLumbeeLuxembourgerMacedonianMalaysianMalteseMarshalleseMenomineeMexicanMexican American IndianMongolianMoroccanNative HawaiianNavajoNepaleseNew ZealanderNicaraguanNigerianNorthern EuropeanNorwegianOkinawanOsageOttawaPaiutePakistaniPalestinianPanamanianParaguayanPennsylvania GermanPeruvianPimaPolishPortuguesePotawatomiPuebloPuerto RicanPuget Sound SalishRomanianRussianSalvadoranSamoanScandinavianScotch-IrishScottishSeminoleSenegaleseSerbianShoshoneSierra LeoneanSiouxSlavicSlovakSloveneSomaliSouth AfricanSouth AmericanSouth American IndianSoviet UnionSpaniardSpanishSpanish AmericanSpanish American IndianSri LankanSubsaharan AfricanSudaneseSwedishSwissSyrianTaiwaneseThaiTlingit-HaidaTohono O'OdhamTonganTrinidadian and TobagonianTsimshianTurkishU.S. Virgin IslanderUgandanUkrainianUruguayanUteVenezuelanVietnameseWelshWest IndianYakamaYaquiYugoslavianYumanYup'ikZimbabwean
Immigration
NonimmigrantsImmigrantsAfghanistanAfricaAlbaniaArgentinaArmeniaAsiaAustraliaAustriaBahamasBangladeshBarbadosBelarusBelgiumBelizeBoliviaBosnia and HerzegovinaBrazilBulgariaBurma/MyanmarCabo VerdeCambodiaCameroonCanadaCaribbeanCentral AmericaChileChinaColombiaCongoCosta RicaCroatiaCubaCzechoslovakiaDenmarkDominicaDominican RepublicEastern AfricaEastern AsiaEastern EuropeEcuadorEgyptEl SalvadorEnglandEritreaEthiopiaEuropeFijiFranceGermanyGhanaGreeceGrenadaGuatemalaGuyanaHaitiHondurasHong KongHungaryIndiaIndonesiaIranIraqIrelandIsraelItalyJamaicaJapanJordanKazakhstanKenyaKoreaKuwaitLaosLatin AmericaLatviaLebanonLiberiaLithuaniaMalaysiaMexicoMicronesiaMiddle AfricaMoldovaMoroccoNetherlandsNicaraguaNigeriaNorth AmericaNorth MacedoniaNorthern AfricaNorthern EuropeNorwayOceaniaPakistanPanamaPeruPhilippinesPolandPortugalRomaniaRussiaSaudi ArabiaScotlandSenegalSerbiaSierra LeoneSingaporeSomaliaSouth AfricaSouth AmericaSouth Central AsiaSouth Eastern AsiaSouthern EuropeSpainSri LankaSt. Vincent and the GrenadinesSudanSwedenSwitzerlandSyriaTaiwanThailandTrinidad and TobagoTurkeyUgandaUkraineUruguayUzbekistanVenezuelaVietnamWest IndiesWestern AfricaWestern AsiaWestern EuropeYemenZaireZimbabweAzores
In Labor Force | Age 20-64
Income
Poverty
Unemployment
Labor Participation
Family Structure
Vehicle Availability
Education Level
Disability

In Labor Force | Age 20-64 Comparison

Immigrants from Nepal

French

Exceptional
Tragic
81.1%
IN LABOR FORCE | AGE 20-64
100.0/ 100
METRIC RATING
16th/ 347
METRIC RANK
78.9%
IN LABOR FORCE | AGE 20-64
1.5/ 100
METRIC RATING
244th/ 347
METRIC RANK

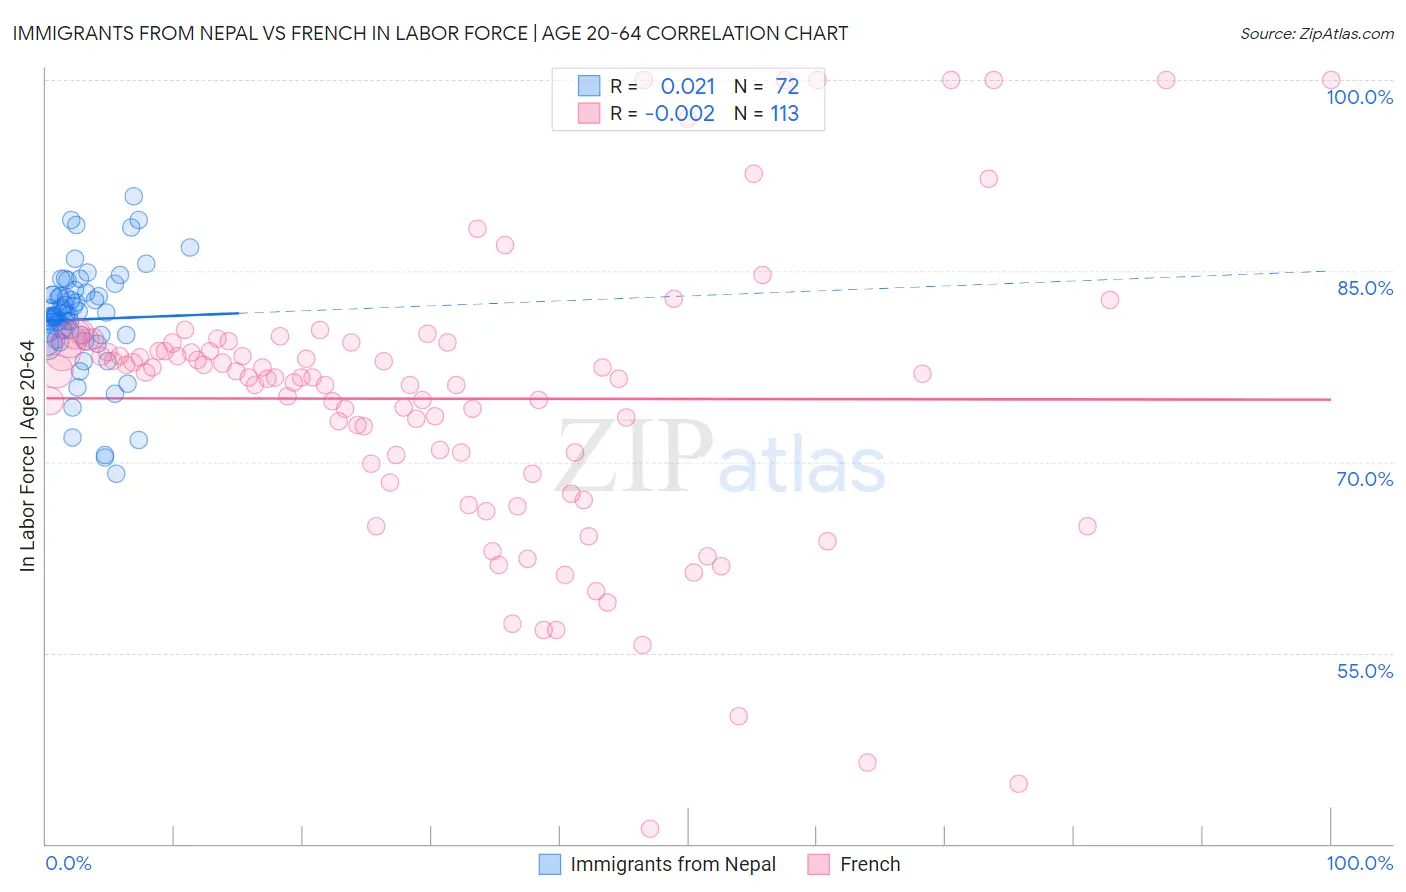
Immigrants from Nepal vs French In Labor Force | Age 20-64 Correlation Chart

The statistical analysis conducted on geographies consisting of 186,792,250 people shows no correlation between the proportion of Immigrants from Nepal and labor force participation rate among population between the ages 20 and 64 in the United States with a correlation coefficient (R) of 0.021 and weighted average of 81.1%. Similarly, the statistical analysis conducted on geographies consisting of 572,422,733 people shows no correlation between the proportion of French and labor force participation rate among population between the ages 20 and 64 in the United States with a correlation coefficient (R) of -0.002 and weighted average of 78.9%, a difference of 2.7%.
Immigrants from Nepal vs French In Labor Force | Age 20-64

In Labor Force | Age 20-64 Correlation Summary

MeasurementImmigrants from NepalFrench
Minimum69.1%41.2%
Maximum90.9%100.0%
Range21.8%58.8%
Mean81.2%75.0%
Median81.5%76.6%
Interquartile 25% (IQ1)79.8%69.5%
Interquartile 75% (IQ3)83.1%79.3%
Interquartile Range (IQR)3.3%9.9%
Standard Deviation (Sample)4.2%11.2%
Standard Deviation (Population)4.2%11.2%

Similar Demographics by In Labor Force | Age 20-64

Demographics Similar to Immigrants from Nepal by In Labor Force | Age 20-64

In terms of in labor force | age 20-64, the demographic groups most similar to Immigrants from Nepal are Bulgarian (81.1%, a difference of 0.0%), Cambodian (81.1%, a difference of 0.020%), Norwegian (81.0%, a difference of 0.11%), Immigrants from Bulgaria (81.0%, a difference of 0.12%), and Zimbabwean (81.0%, a difference of 0.12%).
DemographicsRating | RankIn Labor Force | Age 20-64
Sierra Leoneans
100.0
/100
|
#9
Exceptional
81.5%
Immigrants | Sierra Leone
100.0
/100
|
#10
Exceptional
81.5%
Immigrants | Eastern Africa
100.0
/100
|
#11
Exceptional
81.3%
Immigrants | Eritrea
100.0
/100
|
#12
Exceptional
81.3%
Immigrants | India
100.0
/100
|
#13
Exceptional
81.3%
Cambodians
100.0
/100
|
#14
Exceptional
81.1%
Bulgarians
100.0
/100
|
#15
Exceptional
81.1%
Immigrants | Nepal
100.0
/100
|
#16
Exceptional
81.1%
Norwegians
100.0
/100
|
#17
Exceptional
81.0%
Immigrants | Bulgaria
100.0
/100
|
#18
Exceptional
81.0%
Zimbabweans
100.0
/100
|
#19
Exceptional
81.0%
Thais
100.0
/100
|
#20
Exceptional
80.9%
Liberians
100.0
/100
|
#21
Exceptional
80.9%
Sudanese
100.0
/100
|
#22
Exceptional
80.8%
Immigrants | Bosnia and Herzegovina
100.0
/100
|
#23
Exceptional
80.8%

Demographics Similar to French by In Labor Force | Age 20-64

In terms of in labor force | age 20-64, the demographic groups most similar to French are Immigrants from West Indies (78.9%, a difference of 0.030%), Scottish (78.9%, a difference of 0.040%), Immigrants from Micronesia (78.9%, a difference of 0.050%), Jamaican (78.9%, a difference of 0.060%), and Immigrants from Trinidad and Tobago (78.8%, a difference of 0.060%).
DemographicsRating | RankIn Labor Force | Age 20-64
Immigrants | North America
2.9
/100
|
#237
Tragic
79.0%
Immigrants | Jamaica
2.6
/100
|
#238
Tragic
79.0%
Welsh
2.4
/100
|
#239
Tragic
79.0%
Trinidadians and Tobagonians
2.3
/100
|
#240
Tragic
79.0%
Jamaicans
2.0
/100
|
#241
Tragic
78.9%
Immigrants | Micronesia
1.9
/100
|
#242
Tragic
78.9%
Immigrants | West Indies
1.7
/100
|
#243
Tragic
78.9%
French
1.5
/100
|
#244
Tragic
78.9%
Scottish
1.3
/100
|
#245
Tragic
78.9%
Immigrants | Trinidad and Tobago
1.1
/100
|
#246
Tragic
78.8%
Immigrants | Germany
1.0
/100
|
#247
Tragic
78.8%
Immigrants | Caribbean
1.0
/100
|
#248
Tragic
78.8%
English
0.9
/100
|
#249
Tragic
78.8%
Hondurans
0.8
/100
|
#250
Tragic
78.8%
Barbadians
0.7
/100
|
#251
Tragic
78.8%