Samoan vs Yuman In Labor Force | Age 45-54
COMPARE
Samoan
Yuman
In Labor Force | Age 45-54
In Labor Force | Age 45-54 Comparison
Samoans
Yuman
81.8%
IN LABOR FORCE | AGE 45-54
0.6/ 100
METRIC RATING
243rd/ 347
METRIC RANK
76.3%
IN LABOR FORCE | AGE 45-54
0.0/ 100
METRIC RATING
338th/ 347
METRIC RANK
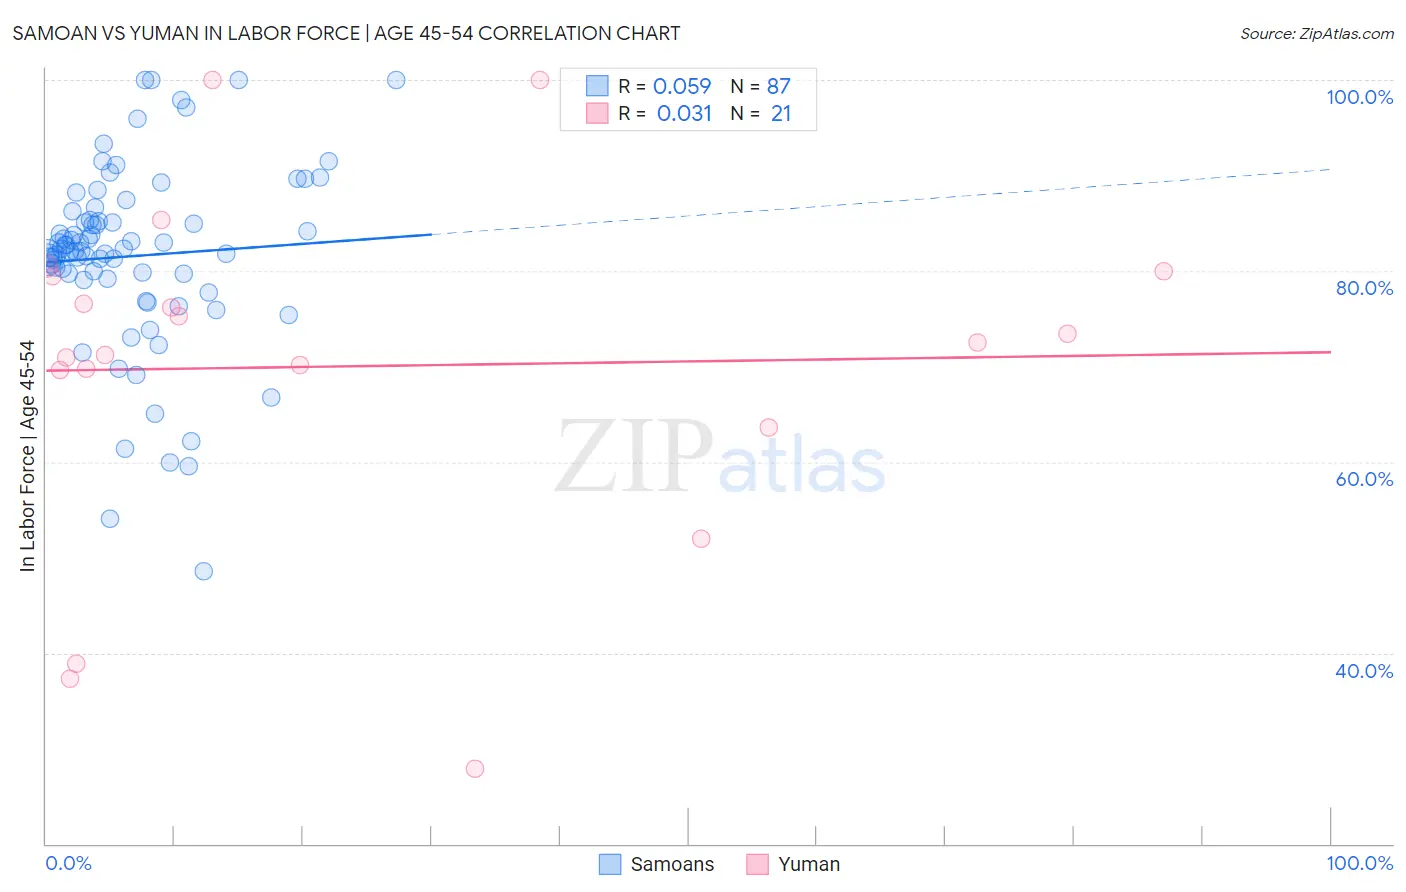
Samoan vs Yuman In Labor Force | Age 45-54 Correlation Chart
The statistical analysis conducted on geographies consisting of 225,090,886 people shows a slight positive correlation between the proportion of Samoans and labor force participation rate among population between the ages 45 and 54 in the United States with a correlation coefficient (R) of 0.059 and weighted average of 81.8%. Similarly, the statistical analysis conducted on geographies consisting of 40,663,251 people shows no correlation between the proportion of Yuman and labor force participation rate among population between the ages 45 and 54 in the United States with a correlation coefficient (R) of 0.031 and weighted average of 76.3%, a difference of 7.2%.
In Labor Force | Age 45-54 Correlation Summary
| Measurement | Samoan | Yuman |
| Minimum | 48.5% | 27.8% |
| Maximum | 100.0% | 100.0% |
| Range | 51.5% | 72.2% |
| Mean | 81.6% | 70.0% |
| Median | 82.1% | 72.5% |
| Interquartile 25% (IQ1) | 79.2% | 66.6% |
| Interquartile 75% (IQ3) | 85.4% | 79.7% |
| Interquartile Range (IQR) | 6.1% | 13.1% |
| Standard Deviation (Sample) | 9.7% | 18.2% |
| Standard Deviation (Population) | 9.6% | 17.8% |
Similar Demographics by In Labor Force | Age 45-54
Demographics Similar to Samoans by In Labor Force | Age 45-54
In terms of in labor force | age 45-54, the demographic groups most similar to Samoans are White/Caucasian (81.9%, a difference of 0.010%), Immigrants from Cambodia (81.9%, a difference of 0.050%), Immigrants from El Salvador (81.9%, a difference of 0.090%), Celtic (81.8%, a difference of 0.090%), and Immigrants from Thailand (81.9%, a difference of 0.10%).
| Demographics | Rating | Rank | In Labor Force | Age 45-54 |
| Basques | 1.2 /100 | #236 | Tragic 82.0% |
| Immigrants | Trinidad and Tobago | 1.2 /100 | #237 | Tragic 82.0% |
| Trinidadians and Tobagonians | 1.1 /100 | #238 | Tragic 81.9% |
| Immigrants | Thailand | 1.0 /100 | #239 | Tragic 81.9% |
| Immigrants | El Salvador | 1.0 /100 | #240 | Tragic 81.9% |
| Immigrants | Cambodia | 0.8 /100 | #241 | Tragic 81.9% |
| Whites/Caucasians | 0.7 /100 | #242 | Tragic 81.9% |
| Samoans | 0.6 /100 | #243 | Tragic 81.8% |
| Celtics | 0.4 /100 | #244 | Tragic 81.8% |
| Alaska Natives | 0.4 /100 | #245 | Tragic 81.8% |
| Alaskan Athabascans | 0.4 /100 | #246 | Tragic 81.8% |
| Central Americans | 0.4 /100 | #247 | Tragic 81.7% |
| Puget Sound Salish | 0.3 /100 | #248 | Tragic 81.7% |
| Hmong | 0.3 /100 | #249 | Tragic 81.7% |
| Immigrants | Armenia | 0.2 /100 | #250 | Tragic 81.7% |
Demographics Similar to Yuman by In Labor Force | Age 45-54
In terms of in labor force | age 45-54, the demographic groups most similar to Yuman are Ute (76.6%, a difference of 0.41%), Paiute (76.7%, a difference of 0.47%), Puerto Rican (75.9%, a difference of 0.48%), Lumbee (75.6%, a difference of 0.95%), and Arapaho (77.1%, a difference of 1.0%).
| Demographics | Rating | Rank | In Labor Force | Age 45-54 |
| Tsimshian | 0.0 /100 | #331 | Tragic 77.4% |
| Menominee | 0.0 /100 | #332 | Tragic 77.4% |
| Natives/Alaskans | 0.0 /100 | #333 | Tragic 77.1% |
| Apache | 0.0 /100 | #334 | Tragic 77.1% |
| Arapaho | 0.0 /100 | #335 | Tragic 77.1% |
| Paiute | 0.0 /100 | #336 | Tragic 76.7% |
| Ute | 0.0 /100 | #337 | Tragic 76.6% |
| Yuman | 0.0 /100 | #338 | Tragic 76.3% |
| Puerto Ricans | 0.0 /100 | #339 | Tragic 75.9% |
| Lumbee | 0.0 /100 | #340 | Tragic 75.6% |
| Pueblo | 0.0 /100 | #341 | Tragic 75.5% |
| Tohono O'odham | 0.0 /100 | #342 | Tragic 75.1% |
| Hopi | 0.0 /100 | #343 | Tragic 75.0% |
| Immigrants | Yemen | 0.0 /100 | #344 | Tragic 74.4% |
| Houma | 0.0 /100 | #345 | Tragic 74.1% |