Pennsylvania German vs Peruvian In Labor Force | Age 25-29

COMPARE

Pennsylvania German
Race
Ancestry
AfghanAfricanAlaska NativeAlaskan AthabascanAlbanianAleutAlsatianAmericanApacheArabArapahoArgentineanArmenianAssyrian/Chaldean/SyriacAustralianAustrianBahamianBangladeshiBarbadianBasqueBelgianBelizeanBermudanBhutaneseBlackfeetBolivianBrazilianBritishBritish West IndianBulgarianBurmeseCajunCambodianCanadianCape VerdeanCarpatho RusynCelticCentral AmericanCentral American IndianCherokeeCheyenneChickasawChileanChineseChippewaChoctawColombianColvilleComancheCosta RicanCreeCreekCroatianCrowCubanCypriotCzechCzechoslovakianDanishDelawareDominicanDutchDutch West IndianEastern EuropeanEcuadorianEgyptianEnglishEstonianEthiopianEuropeanFijianFilipinoFinnishFrenchFrench American IndianFrench CanadianGermanGerman RussianGhanaianGreekGuamanian/ChamorroGuatemalanGuyaneseHaitianHmongHonduranHopiHoumaHungarianIcelanderIndian (Asian)IndonesianInupiatIranianIraqiIrishIroquoisIsraeliItalianJamaicanJapaneseJordanianKenyanKiowaKoreanLaotianLatvianLebaneseLiberianLithuanianLumbeeLuxembourgerMacedonianMalaysianMalteseMarshalleseMenomineeMexicanMexican American IndianMongolianMoroccanNative HawaiianNavajoNepaleseNew ZealanderNicaraguanNigerianNorthern EuropeanNorwegianOkinawanOsageOttawaPaiutePakistaniPalestinianPanamanianParaguayanPennsylvania GermanPimaPolishPortuguesePotawatomiPuebloPuerto RicanPuget Sound SalishRomanianRussianSalvadoranSamoanScandinavianScotch-IrishScottishSeminoleSenegaleseSerbianShoshoneSierra LeoneanSiouxSlavicSlovakSloveneSomaliSouth AfricanSouth AmericanSouth American IndianSoviet UnionSpaniardSpanishSpanish AmericanSpanish American IndianSri LankanSubsaharan AfricanSudaneseSwedishSwissSyrianTaiwaneseThaiTlingit-HaidaTohono O'OdhamTonganTrinidadian and TobagonianTsimshianTurkishU.S. Virgin IslanderUgandanUkrainianUruguayanUteVenezuelanVietnameseWelshWest IndianYakamaYaquiYugoslavianYumanYup'ikZimbabwean
Immigration
NonimmigrantsImmigrantsAfghanistanAfricaAlbaniaArgentinaArmeniaAsiaAustraliaAustriaBahamasBangladeshBarbadosBelarusBelgiumBelizeBoliviaBosnia and HerzegovinaBrazilBulgariaBurma/MyanmarCabo VerdeCambodiaCameroonCanadaCaribbeanCentral AmericaChileChinaColombiaCongoCosta RicaCroatiaCubaCzechoslovakiaDenmarkDominicaDominican RepublicEastern AfricaEastern AsiaEastern EuropeEcuadorEgyptEl SalvadorEnglandEritreaEthiopiaEuropeFijiFranceGermanyGhanaGreeceGrenadaGuatemalaGuyanaHaitiHondurasHong KongHungaryIndiaIndonesiaIranIraqIrelandIsraelItalyJamaicaJapanJordanKazakhstanKenyaKoreaKuwaitLaosLatin AmericaLatviaLebanonLiberiaLithuaniaMalaysiaMexicoMicronesiaMiddle AfricaMoldovaMoroccoNepalNetherlandsNicaraguaNigeriaNorth AmericaNorth MacedoniaNorthern AfricaNorthern EuropeNorwayOceaniaPakistanPanamaPeruPhilippinesPolandPortugalRomaniaRussiaSaudi ArabiaScotlandSenegalSerbiaSierra LeoneSingaporeSomaliaSouth AfricaSouth AmericaSouth Central AsiaSouth Eastern AsiaSouthern EuropeSpainSri LankaSt. Vincent and the GrenadinesSudanSwedenSwitzerlandSyriaTaiwanThailandTrinidad and TobagoTurkeyUgandaUkraineUruguayUzbekistanVenezuelaVietnamWest IndiesWestern AfricaWestern AsiaWestern EuropeYemenZaireZimbabweAzores
Peruvian
Race
Ancestry
AfghanAfricanAlaska NativeAlaskan AthabascanAlbanianAleutAlsatianAmericanApacheArabArapahoArgentineanArmenianAssyrian/Chaldean/SyriacAustralianAustrianBahamianBangladeshiBarbadianBasqueBelgianBelizeanBermudanBhutaneseBlackfeetBolivianBrazilianBritishBritish West IndianBulgarianBurmeseCajunCambodianCanadianCape VerdeanCarpatho RusynCelticCentral AmericanCentral American IndianCherokeeCheyenneChickasawChileanChineseChippewaChoctawColombianColvilleComancheCosta RicanCreeCreekCroatianCrowCubanCypriotCzechCzechoslovakianDanishDelawareDominicanDutchDutch West IndianEastern EuropeanEcuadorianEgyptianEnglishEstonianEthiopianEuropeanFijianFilipinoFinnishFrenchFrench American IndianFrench CanadianGermanGerman RussianGhanaianGreekGuamanian/ChamorroGuatemalanGuyaneseHaitianHmongHonduranHopiHoumaHungarianIcelanderIndian (Asian)IndonesianInupiatIranianIraqiIrishIroquoisIsraeliItalianJamaicanJapaneseJordanianKenyanKiowaKoreanLaotianLatvianLebaneseLiberianLithuanianLumbeeLuxembourgerMacedonianMalaysianMalteseMarshalleseMenomineeMexicanMexican American IndianMongolianMoroccanNative HawaiianNavajoNepaleseNew ZealanderNicaraguanNigerianNorthern EuropeanNorwegianOkinawanOsageOttawaPaiutePakistaniPalestinianPanamanianParaguayanPeruvianPimaPolishPortuguesePotawatomiPuebloPuerto RicanPuget Sound SalishRomanianRussianSalvadoranSamoanScandinavianScotch-IrishScottishSeminoleSenegaleseSerbianShoshoneSierra LeoneanSiouxSlavicSlovakSloveneSomaliSouth AfricanSouth AmericanSouth American IndianSoviet UnionSpaniardSpanishSpanish AmericanSpanish American IndianSri LankanSubsaharan AfricanSudaneseSwedishSwissSyrianTaiwaneseThaiTlingit-HaidaTohono O'OdhamTonganTrinidadian and TobagonianTsimshianTurkishU.S. Virgin IslanderUgandanUkrainianUruguayanUteVenezuelanVietnameseWelshWest IndianYakamaYaquiYugoslavianYumanYup'ikZimbabwean
Immigration
NonimmigrantsImmigrantsAfghanistanAfricaAlbaniaArgentinaArmeniaAsiaAustraliaAustriaBahamasBangladeshBarbadosBelarusBelgiumBelizeBoliviaBosnia and HerzegovinaBrazilBulgariaBurma/MyanmarCabo VerdeCambodiaCameroonCanadaCaribbeanCentral AmericaChileChinaColombiaCongoCosta RicaCroatiaCubaCzechoslovakiaDenmarkDominicaDominican RepublicEastern AfricaEastern AsiaEastern EuropeEcuadorEgyptEl SalvadorEnglandEritreaEthiopiaEuropeFijiFranceGermanyGhanaGreeceGrenadaGuatemalaGuyanaHaitiHondurasHong KongHungaryIndiaIndonesiaIranIraqIrelandIsraelItalyJamaicaJapanJordanKazakhstanKenyaKoreaKuwaitLaosLatin AmericaLatviaLebanonLiberiaLithuaniaMalaysiaMexicoMicronesiaMiddle AfricaMoldovaMoroccoNepalNetherlandsNicaraguaNigeriaNorth AmericaNorth MacedoniaNorthern AfricaNorthern EuropeNorwayOceaniaPakistanPanamaPeruPhilippinesPolandPortugalRomaniaRussiaSaudi ArabiaScotlandSenegalSerbiaSierra LeoneSingaporeSomaliaSouth AfricaSouth AmericaSouth Central AsiaSouth Eastern AsiaSouthern EuropeSpainSri LankaSt. Vincent and the GrenadinesSudanSwedenSwitzerlandSyriaTaiwanThailandTrinidad and TobagoTurkeyUgandaUkraineUruguayUzbekistanVenezuelaVietnamWest IndiesWestern AfricaWestern AsiaWestern EuropeYemenZaireZimbabweAzores
In Labor Force | Age 25-29
Income
Poverty
Unemployment
Labor Participation
Family Structure
Vehicle Availability
Education Level
Disability

In Labor Force | Age 25-29 Comparison

Pennsylvania Germans

Peruvians

Tragic
Good
83.6%
IN LABOR FORCE | AGE 25-29
0.1/ 100
METRIC RATING
261st/ 347
METRIC RANK
84.7%
IN LABOR FORCE | AGE 25-29
64.7/ 100
METRIC RATING
149th/ 347
METRIC RANK

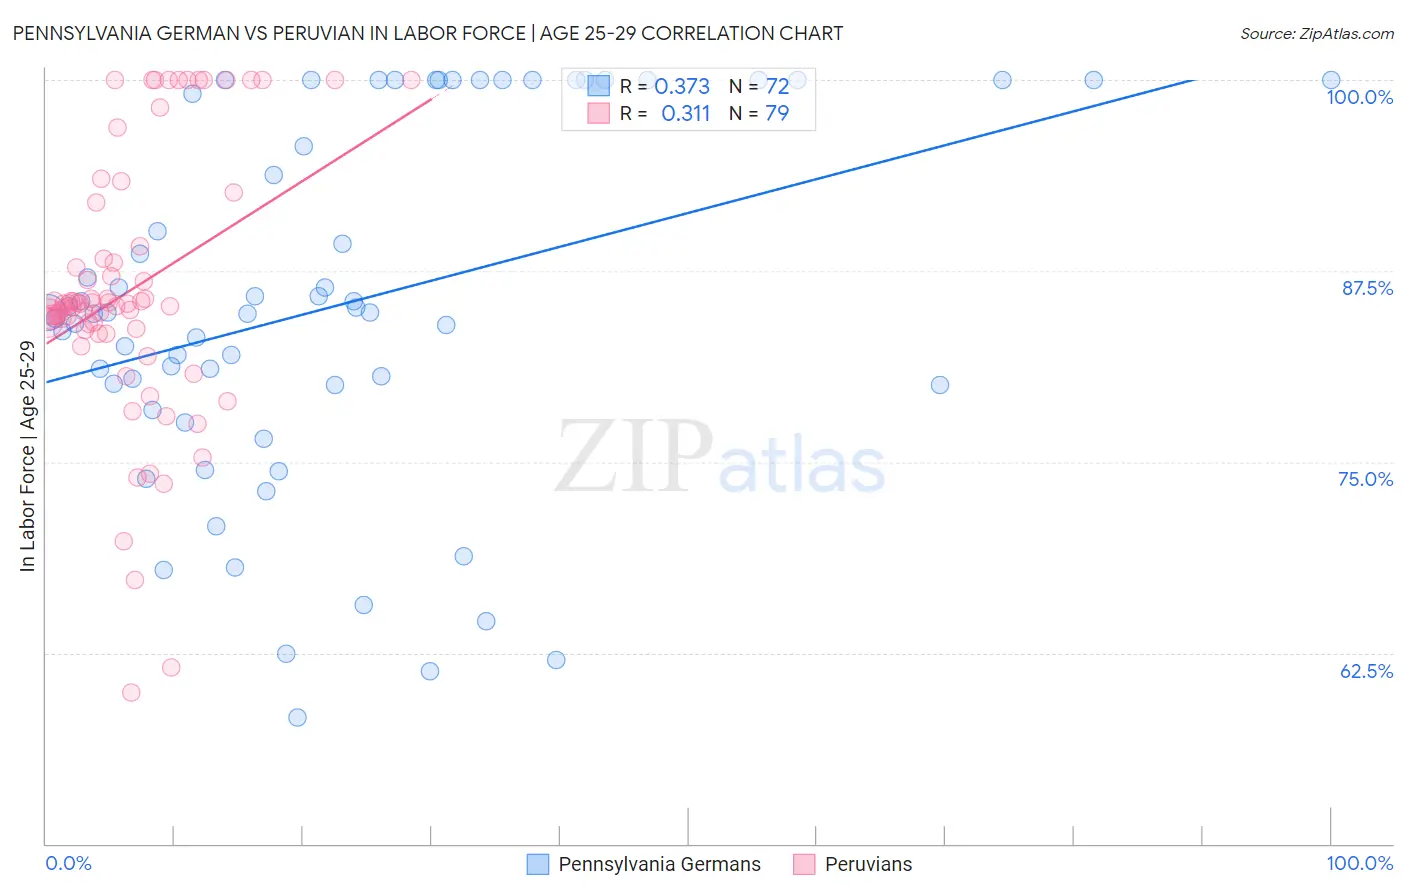
Pennsylvania German vs Peruvian In Labor Force | Age 25-29 Correlation Chart

The statistical analysis conducted on geographies consisting of 234,004,044 people shows a mild positive correlation between the proportion of Pennsylvania Germans and labor force participation rate among population between the ages 25 and 29 in the United States with a correlation coefficient (R) of 0.373 and weighted average of 83.6%. Similarly, the statistical analysis conducted on geographies consisting of 363,155,715 people shows a mild positive correlation between the proportion of Peruvians and labor force participation rate among population between the ages 25 and 29 in the United States with a correlation coefficient (R) of 0.311 and weighted average of 84.7%, a difference of 1.4%.
Pennsylvania German vs Peruvian In Labor Force | Age 25-29

In Labor Force | Age 25-29 Correlation Summary

MeasurementPennsylvania GermanPeruvian
Minimum58.3%59.9%
Maximum100.0%100.0%
Range41.7%40.1%
Mean85.3%86.2%
Median84.8%85.3%
Interquartile 25% (IQ1)80.0%83.7%
Interquartile 75% (IQ3)100.0%89.1%
Interquartile Range (IQR)20.0%5.4%
Standard Deviation (Sample)11.7%8.7%
Standard Deviation (Population)11.6%8.6%

Similar Demographics by In Labor Force | Age 25-29

Demographics Similar to Pennsylvania Germans by In Labor Force | Age 25-29

In terms of in labor force | age 25-29, the demographic groups most similar to Pennsylvania Germans are Immigrants from Bahamas (83.6%, a difference of 0.0%), Spanish (83.6%, a difference of 0.010%), Immigrants from Guatemala (83.6%, a difference of 0.020%), Delaware (83.7%, a difference of 0.060%), and Immigrants from Fiji (83.6%, a difference of 0.060%).
DemographicsRating | RankIn Labor Force | Age 25-29
Spaniards
0.2
/100
|
#254
Tragic
83.7%
Haitians
0.2
/100
|
#255
Tragic
83.7%
Immigrants | Haiti
0.2
/100
|
#256
Tragic
83.7%
Delaware
0.2
/100
|
#257
Tragic
83.7%
Immigrants | Guatemala
0.1
/100
|
#258
Tragic
83.6%
Spanish
0.1
/100
|
#259
Tragic
83.6%
Immigrants | Bahamas
0.1
/100
|
#260
Tragic
83.6%
Pennsylvania Germans
0.1
/100
|
#261
Tragic
83.6%
Immigrants | Fiji
0.1
/100
|
#262
Tragic
83.6%
West Indians
0.1
/100
|
#263
Tragic
83.5%
Puget Sound Salish
0.1
/100
|
#264
Tragic
83.5%
Cubans
0.1
/100
|
#265
Tragic
83.5%
Aleuts
0.0
/100
|
#266
Tragic
83.4%
Spanish Americans
0.0
/100
|
#267
Tragic
83.4%
Immigrants | Lebanon
0.0
/100
|
#268
Tragic
83.4%

Demographics Similar to Peruvians by In Labor Force | Age 25-29

In terms of in labor force | age 25-29, the demographic groups most similar to Peruvians are Immigrants from England (84.7%, a difference of 0.0%), Swiss (84.7%, a difference of 0.0%), Colombian (84.7%, a difference of 0.010%), Immigrants from Pakistan (84.7%, a difference of 0.020%), and Immigrants from Taiwan (84.7%, a difference of 0.020%).
DemographicsRating | RankIn Labor Force | Age 25-29
Pakistanis
70.0
/100
|
#142
Good
84.8%
Sri Lankans
69.2
/100
|
#143
Good
84.8%
Immigrants | Laos
69.0
/100
|
#144
Good
84.8%
Immigrants | Senegal
68.3
/100
|
#145
Good
84.8%
Icelanders
68.2
/100
|
#146
Good
84.8%
Immigrants | Asia
68.2
/100
|
#147
Good
84.8%
Immigrants | England
65.2
/100
|
#148
Good
84.7%
Peruvians
64.7
/100
|
#149
Good
84.7%
Swiss
64.7
/100
|
#150
Good
84.7%
Colombians
62.8
/100
|
#151
Good
84.7%
Immigrants | Pakistan
62.7
/100
|
#152
Good
84.7%
Immigrants | Taiwan
62.2
/100
|
#153
Good
84.7%
Immigrants | Sri Lanka
61.7
/100
|
#154
Good
84.7%
Indians (Asian)
61.6
/100
|
#155
Good
84.7%
French
61.0
/100
|
#156
Good
84.7%