Immigrants from Singapore vs Peruvian In Labor Force | Age 25-29

COMPARE

Immigrants from Singapore
Race
Ancestry
AfghanAfricanAlaska NativeAlaskan AthabascanAlbanianAleutAlsatianAmericanApacheArabArapahoArgentineanArmenianAssyrian/Chaldean/SyriacAustralianAustrianBahamianBangladeshiBarbadianBasqueBelgianBelizeanBermudanBhutaneseBlackfeetBolivianBrazilianBritishBritish West IndianBulgarianBurmeseCajunCambodianCanadianCape VerdeanCarpatho RusynCelticCentral AmericanCentral American IndianCherokeeCheyenneChickasawChileanChineseChippewaChoctawColombianColvilleComancheCosta RicanCreeCreekCroatianCrowCubanCypriotCzechCzechoslovakianDanishDelawareDominicanDutchDutch West IndianEastern EuropeanEcuadorianEgyptianEnglishEstonianEthiopianEuropeanFijianFilipinoFinnishFrenchFrench American IndianFrench CanadianGermanGerman RussianGhanaianGreekGuamanian/ChamorroGuatemalanGuyaneseHaitianHmongHonduranHopiHoumaHungarianIcelanderIndian (Asian)IndonesianInupiatIranianIraqiIrishIroquoisIsraeliItalianJamaicanJapaneseJordanianKenyanKiowaKoreanLaotianLatvianLebaneseLiberianLithuanianLumbeeLuxembourgerMacedonianMalaysianMalteseMarshalleseMenomineeMexicanMexican American IndianMongolianMoroccanNative HawaiianNavajoNepaleseNew ZealanderNicaraguanNigerianNorthern EuropeanNorwegianOkinawanOsageOttawaPaiutePakistaniPalestinianPanamanianParaguayanPennsylvania GermanPimaPolishPortuguesePotawatomiPuebloPuerto RicanPuget Sound SalishRomanianRussianSalvadoranSamoanScandinavianScotch-IrishScottishSeminoleSenegaleseSerbianShoshoneSierra LeoneanSiouxSlavicSlovakSloveneSomaliSouth AfricanSouth AmericanSouth American IndianSoviet UnionSpaniardSpanishSpanish AmericanSpanish American IndianSri LankanSubsaharan AfricanSudaneseSwedishSwissSyrianTaiwaneseThaiTlingit-HaidaTohono O'OdhamTonganTrinidadian and TobagonianTsimshianTurkishU.S. Virgin IslanderUgandanUkrainianUruguayanUteVenezuelanVietnameseWelshWest IndianYakamaYaquiYugoslavianYumanYup'ikZimbabwean
Immigration
NonimmigrantsImmigrantsAfghanistanAfricaAlbaniaArgentinaArmeniaAsiaAustraliaAustriaBahamasBangladeshBarbadosBelarusBelgiumBelizeBoliviaBosnia and HerzegovinaBrazilBulgariaBurma/MyanmarCabo VerdeCambodiaCameroonCanadaCaribbeanCentral AmericaChileChinaColombiaCongoCosta RicaCroatiaCubaCzechoslovakiaDenmarkDominicaDominican RepublicEastern AfricaEastern AsiaEastern EuropeEcuadorEgyptEl SalvadorEnglandEritreaEthiopiaEuropeFijiFranceGermanyGhanaGreeceGrenadaGuatemalaGuyanaHaitiHondurasHong KongHungaryIndiaIndonesiaIranIraqIrelandIsraelItalyJamaicaJapanJordanKazakhstanKenyaKoreaKuwaitLaosLatin AmericaLatviaLebanonLiberiaLithuaniaMalaysiaMexicoMicronesiaMiddle AfricaMoldovaMoroccoNepalNetherlandsNicaraguaNigeriaNorth AmericaNorth MacedoniaNorthern AfricaNorthern EuropeNorwayOceaniaPakistanPanamaPeruPhilippinesPolandPortugalRomaniaRussiaSaudi ArabiaScotlandSenegalSerbiaSierra LeoneSingaporeSomaliaSouth AfricaSouth AmericaSouth Central AsiaSouth Eastern AsiaSouthern EuropeSpainSri LankaSt. Vincent and the GrenadinesSudanSwedenSwitzerlandSyriaTaiwanThailandTrinidad and TobagoTurkeyUgandaUkraineUruguayUzbekistanVenezuelaVietnamWest IndiesWestern AfricaWestern AsiaWestern EuropeYemenZaireZimbabweAzores
Peruvian
Race
Ancestry
AfghanAfricanAlaska NativeAlaskan AthabascanAlbanianAleutAlsatianAmericanApacheArabArapahoArgentineanArmenianAssyrian/Chaldean/SyriacAustralianAustrianBahamianBangladeshiBarbadianBasqueBelgianBelizeanBermudanBhutaneseBlackfeetBolivianBrazilianBritishBritish West IndianBulgarianBurmeseCajunCambodianCanadianCape VerdeanCarpatho RusynCelticCentral AmericanCentral American IndianCherokeeCheyenneChickasawChileanChineseChippewaChoctawColombianColvilleComancheCosta RicanCreeCreekCroatianCrowCubanCypriotCzechCzechoslovakianDanishDelawareDominicanDutchDutch West IndianEastern EuropeanEcuadorianEgyptianEnglishEstonianEthiopianEuropeanFijianFilipinoFinnishFrenchFrench American IndianFrench CanadianGermanGerman RussianGhanaianGreekGuamanian/ChamorroGuatemalanGuyaneseHaitianHmongHonduranHopiHoumaHungarianIcelanderIndian (Asian)IndonesianInupiatIranianIraqiIrishIroquoisIsraeliItalianJamaicanJapaneseJordanianKenyanKiowaKoreanLaotianLatvianLebaneseLiberianLithuanianLumbeeLuxembourgerMacedonianMalaysianMalteseMarshalleseMenomineeMexicanMexican American IndianMongolianMoroccanNative HawaiianNavajoNepaleseNew ZealanderNicaraguanNigerianNorthern EuropeanNorwegianOkinawanOsageOttawaPaiutePakistaniPalestinianPanamanianParaguayanPennsylvania GermanPeruvianPimaPolishPortuguesePotawatomiPuebloPuerto RicanPuget Sound SalishRomanianRussianSalvadoranSamoanScandinavianScotch-IrishScottishSeminoleSenegaleseSerbianShoshoneSierra LeoneanSiouxSlavicSlovakSloveneSomaliSouth AfricanSouth AmericanSouth American IndianSoviet UnionSpaniardSpanishSpanish AmericanSpanish American IndianSri LankanSubsaharan AfricanSudaneseSwedishSwissSyrianTaiwaneseThaiTlingit-HaidaTohono O'OdhamTonganTrinidadian and TobagonianTsimshianTurkishU.S. Virgin IslanderUgandanUkrainianUruguayanUteVenezuelanVietnameseWelshWest IndianYakamaYaquiYugoslavianYumanYup'ikZimbabwean
Immigration
NonimmigrantsImmigrantsAfghanistanAfricaAlbaniaArgentinaArmeniaAsiaAustraliaAustriaBahamasBangladeshBarbadosBelarusBelgiumBelizeBoliviaBosnia and HerzegovinaBrazilBulgariaBurma/MyanmarCabo VerdeCambodiaCameroonCanadaCaribbeanCentral AmericaChileChinaColombiaCongoCosta RicaCroatiaCubaCzechoslovakiaDenmarkDominicaDominican RepublicEastern AfricaEastern AsiaEastern EuropeEcuadorEgyptEl SalvadorEnglandEritreaEthiopiaEuropeFijiFranceGermanyGhanaGreeceGrenadaGuatemalaGuyanaHaitiHondurasHong KongHungaryIndiaIndonesiaIranIraqIrelandIsraelItalyJamaicaJapanJordanKazakhstanKenyaKoreaKuwaitLaosLatin AmericaLatviaLebanonLiberiaLithuaniaMalaysiaMexicoMicronesiaMiddle AfricaMoldovaMoroccoNepalNetherlandsNicaraguaNigeriaNorth AmericaNorth MacedoniaNorthern AfricaNorthern EuropeNorwayOceaniaPakistanPanamaPeruPhilippinesPolandPortugalRomaniaRussiaSaudi ArabiaScotlandSenegalSerbiaSierra LeoneSomaliaSouth AfricaSouth AmericaSouth Central AsiaSouth Eastern AsiaSouthern EuropeSpainSri LankaSt. Vincent and the GrenadinesSudanSwedenSwitzerlandSyriaTaiwanThailandTrinidad and TobagoTurkeyUgandaUkraineUruguayUzbekistanVenezuelaVietnamWest IndiesWestern AfricaWestern AsiaWestern EuropeYemenZaireZimbabweAzores
In Labor Force | Age 25-29
Income
Poverty
Unemployment
Labor Participation
Family Structure
Vehicle Availability
Education Level
Disability

In Labor Force | Age 25-29 Comparison

Immigrants from Singapore

Peruvians

Excellent
Good
84.9%
IN LABOR FORCE | AGE 25-29
84.4/ 100
METRIC RATING
126th/ 347
METRIC RANK
84.7%
IN LABOR FORCE | AGE 25-29
64.7/ 100
METRIC RATING
149th/ 347
METRIC RANK

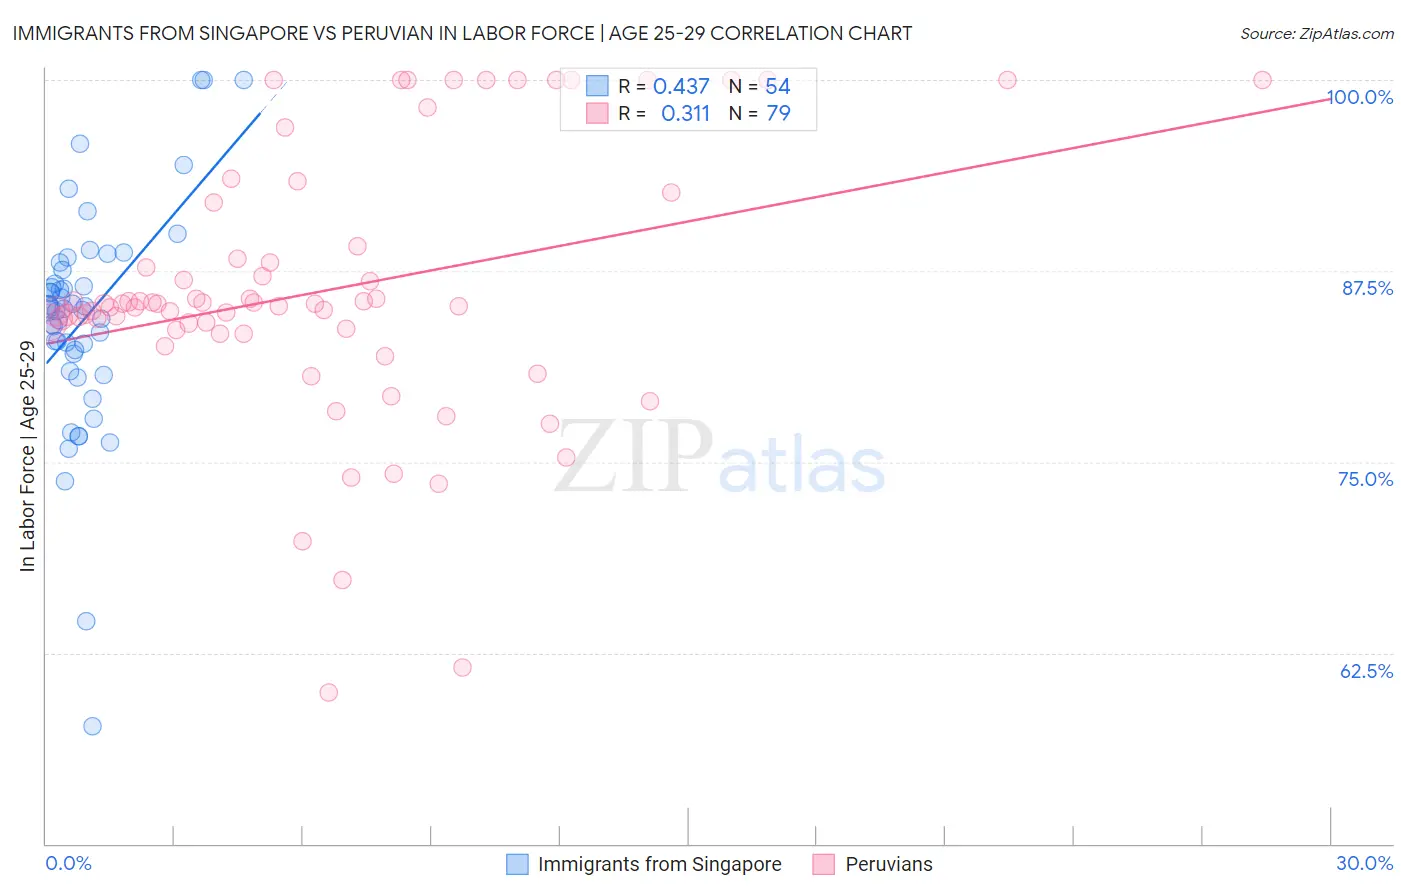
Immigrants from Singapore vs Peruvian In Labor Force | Age 25-29 Correlation Chart

The statistical analysis conducted on geographies consisting of 137,510,169 people shows a moderate positive correlation between the proportion of Immigrants from Singapore and labor force participation rate among population between the ages 25 and 29 in the United States with a correlation coefficient (R) of 0.437 and weighted average of 84.9%. Similarly, the statistical analysis conducted on geographies consisting of 363,155,715 people shows a mild positive correlation between the proportion of Peruvians and labor force participation rate among population between the ages 25 and 29 in the United States with a correlation coefficient (R) of 0.311 and weighted average of 84.7%, a difference of 0.20%.
Immigrants from Singapore vs Peruvian In Labor Force | Age 25-29

In Labor Force | Age 25-29 Correlation Summary

MeasurementImmigrants from SingaporePeruvian
Minimum57.7%59.9%
Maximum100.0%100.0%
Range42.3%40.1%
Mean84.4%86.2%
Median85.0%85.3%
Interquartile 25% (IQ1)82.1%83.7%
Interquartile 75% (IQ3)87.6%89.1%
Interquartile Range (IQR)5.5%5.4%
Standard Deviation (Sample)7.4%8.7%
Standard Deviation (Population)7.3%8.6%

Similar Demographics by In Labor Force | Age 25-29

Demographics Similar to Immigrants from Singapore by In Labor Force | Age 25-29

In terms of in labor force | age 25-29, the demographic groups most similar to Immigrants from Singapore are Uruguayan (84.9%, a difference of 0.0%), Scandinavian (84.9%, a difference of 0.010%), Dutch (84.9%, a difference of 0.010%), Immigrants from Iran (84.9%, a difference of 0.010%), and Immigrants from Uruguay (84.9%, a difference of 0.010%).
DemographicsRating | RankIn Labor Force | Age 25-29
Filipinos
87.1
/100
|
#119
Excellent
84.9%
Immigrants | South Africa
86.1
/100
|
#120
Excellent
84.9%
Immigrants | Chile
85.6
/100
|
#121
Excellent
84.9%
Scandinavians
85.1
/100
|
#122
Excellent
84.9%
Dutch
84.9
/100
|
#123
Excellent
84.9%
Immigrants | Iran
84.8
/100
|
#124
Excellent
84.9%
Uruguayans
84.7
/100
|
#125
Excellent
84.9%
Immigrants | Singapore
84.4
/100
|
#126
Excellent
84.9%
Immigrants | Uruguay
84.0
/100
|
#127
Excellent
84.9%
Australians
83.6
/100
|
#128
Excellent
84.9%
Immigrants | Russia
81.6
/100
|
#129
Excellent
84.9%
Northern Europeans
81.3
/100
|
#130
Excellent
84.9%
Iranians
78.1
/100
|
#131
Good
84.8%
Romanians
77.7
/100
|
#132
Good
84.8%
Asians
77.7
/100
|
#133
Good
84.8%

Demographics Similar to Peruvians by In Labor Force | Age 25-29

In terms of in labor force | age 25-29, the demographic groups most similar to Peruvians are Immigrants from England (84.7%, a difference of 0.0%), Swiss (84.7%, a difference of 0.0%), Colombian (84.7%, a difference of 0.010%), Immigrants from Pakistan (84.7%, a difference of 0.020%), and Immigrants from Taiwan (84.7%, a difference of 0.020%).
DemographicsRating | RankIn Labor Force | Age 25-29
Pakistanis
70.0
/100
|
#142
Good
84.8%
Sri Lankans
69.2
/100
|
#143
Good
84.8%
Immigrants | Laos
69.0
/100
|
#144
Good
84.8%
Immigrants | Senegal
68.3
/100
|
#145
Good
84.8%
Icelanders
68.2
/100
|
#146
Good
84.8%
Immigrants | Asia
68.2
/100
|
#147
Good
84.8%
Immigrants | England
65.2
/100
|
#148
Good
84.7%
Peruvians
64.7
/100
|
#149
Good
84.7%
Swiss
64.7
/100
|
#150
Good
84.7%
Colombians
62.8
/100
|
#151
Good
84.7%
Immigrants | Pakistan
62.7
/100
|
#152
Good
84.7%
Immigrants | Taiwan
62.2
/100
|
#153
Good
84.7%
Immigrants | Sri Lanka
61.7
/100
|
#154
Good
84.7%
Indians (Asian)
61.6
/100
|
#155
Good
84.7%
French
61.0
/100
|
#156
Good
84.7%