Osage vs Immigrants from England In Labor Force | Age 35-44

COMPARE

Osage
Race
Ancestry
AfghanAfricanAlaska NativeAlaskan AthabascanAlbanianAleutAlsatianAmericanApacheArabArapahoArgentineanArmenianAssyrian/Chaldean/SyriacAustralianAustrianBahamianBangladeshiBarbadianBasqueBelgianBelizeanBermudanBhutaneseBlackfeetBolivianBrazilianBritishBritish West IndianBulgarianBurmeseCajunCambodianCanadianCape VerdeanCarpatho RusynCelticCentral AmericanCentral American IndianCherokeeCheyenneChickasawChileanChineseChippewaChoctawColombianColvilleComancheCosta RicanCreeCreekCroatianCrowCubanCypriotCzechCzechoslovakianDanishDelawareDominicanDutchDutch West IndianEastern EuropeanEcuadorianEgyptianEnglishEstonianEthiopianEuropeanFijianFilipinoFinnishFrenchFrench American IndianFrench CanadianGermanGerman RussianGhanaianGreekGuamanian/ChamorroGuatemalanGuyaneseHaitianHmongHonduranHopiHoumaHungarianIcelanderIndian (Asian)IndonesianInupiatIranianIraqiIrishIroquoisIsraeliItalianJamaicanJapaneseJordanianKenyanKiowaKoreanLaotianLatvianLebaneseLiberianLithuanianLumbeeLuxembourgerMacedonianMalaysianMalteseMarshalleseMenomineeMexicanMexican American IndianMongolianMoroccanNative HawaiianNavajoNepaleseNew ZealanderNicaraguanNigerianNorthern EuropeanNorwegianOkinawanOsageOttawaPaiutePakistaniPalestinianPanamanianParaguayanPennsylvania GermanPeruvianPimaPolishPortuguesePotawatomiPuebloPuerto RicanPuget Sound SalishRomanianRussianSalvadoranSamoanScandinavianScotch-IrishScottishSeminoleSenegaleseSerbianShoshoneSierra LeoneanSiouxSlavicSlovakSloveneSomaliSouth AfricanSouth AmericanSouth American IndianSoviet UnionSpaniardSpanishSpanish AmericanSpanish American IndianSri LankanSubsaharan AfricanSudaneseSwedishSwissSyrianTaiwaneseThaiTlingit-HaidaTohono O'OdhamTonganTrinidadian and TobagonianTsimshianTurkishU.S. Virgin IslanderUgandanUkrainianUruguayanUteVenezuelanVietnameseWelshWest IndianYakamaYaquiYugoslavianYumanYup'ikZimbabwean
Immigration
NonimmigrantsImmigrantsAfghanistanAfricaAlbaniaArgentinaArmeniaAsiaAustraliaAustriaBahamasBangladeshBarbadosBelarusBelgiumBelizeBoliviaBosnia and HerzegovinaBrazilBulgariaBurma/MyanmarCabo VerdeCambodiaCameroonCanadaCaribbeanCentral AmericaChileChinaColombiaCongoCosta RicaCroatiaCubaCzechoslovakiaDenmarkDominicaDominican RepublicEastern AfricaEastern AsiaEastern EuropeEcuadorEgyptEl SalvadorEritreaEthiopiaEuropeFijiFranceGermanyGhanaGreeceGrenadaGuatemalaGuyanaHaitiHondurasHong KongHungaryIndiaIndonesiaIranIraqIrelandIsraelItalyJamaicaJapanJordanKazakhstanKenyaKoreaKuwaitLaosLatin AmericaLatviaLebanonLiberiaLithuaniaMalaysiaMexicoMicronesiaMiddle AfricaMoldovaMoroccoNepalNetherlandsNicaraguaNigeriaNorth AmericaNorth MacedoniaNorthern AfricaNorthern EuropeNorwayOceaniaPakistanPanamaPeruPhilippinesPolandPortugalRomaniaRussiaSaudi ArabiaScotlandSenegalSerbiaSierra LeoneSingaporeSomaliaSouth AfricaSouth AmericaSouth Central AsiaSouth Eastern AsiaSouthern EuropeSpainSri LankaSt. Vincent and the GrenadinesSudanSwedenSwitzerlandSyriaTaiwanThailandTrinidad and TobagoTurkeyUgandaUkraineUruguayUzbekistanVenezuelaVietnamWest IndiesWestern AfricaWestern AsiaWestern EuropeYemenZaireZimbabweAzores
Immigrants from England
Race
Ancestry
AfghanAfricanAlaska NativeAlaskan AthabascanAlbanianAleutAlsatianAmericanApacheArabArapahoArgentineanArmenianAssyrian/Chaldean/SyriacAustralianAustrianBahamianBangladeshiBarbadianBasqueBelgianBelizeanBermudanBhutaneseBlackfeetBolivianBrazilianBritishBritish West IndianBulgarianBurmeseCajunCambodianCanadianCape VerdeanCarpatho RusynCelticCentral AmericanCentral American IndianCherokeeCheyenneChickasawChileanChineseChippewaChoctawColombianColvilleComancheCosta RicanCreeCreekCroatianCrowCubanCypriotCzechCzechoslovakianDanishDelawareDominicanDutchDutch West IndianEastern EuropeanEcuadorianEgyptianEnglishEstonianEthiopianEuropeanFijianFilipinoFinnishFrenchFrench American IndianFrench CanadianGermanGerman RussianGhanaianGreekGuamanian/ChamorroGuatemalanGuyaneseHaitianHmongHonduranHopiHoumaHungarianIcelanderIndian (Asian)IndonesianInupiatIranianIraqiIrishIroquoisIsraeliItalianJamaicanJapaneseJordanianKenyanKiowaKoreanLaotianLatvianLebaneseLiberianLithuanianLumbeeLuxembourgerMacedonianMalaysianMalteseMarshalleseMenomineeMexicanMexican American IndianMongolianMoroccanNative HawaiianNavajoNepaleseNew ZealanderNicaraguanNigerianNorthern EuropeanNorwegianOkinawanOttawaPaiutePakistaniPalestinianPanamanianParaguayanPennsylvania GermanPeruvianPimaPolishPortuguesePotawatomiPuebloPuerto RicanPuget Sound SalishRomanianRussianSalvadoranSamoanScandinavianScotch-IrishScottishSeminoleSenegaleseSerbianShoshoneSierra LeoneanSiouxSlavicSlovakSloveneSomaliSouth AfricanSouth AmericanSouth American IndianSoviet UnionSpaniardSpanishSpanish AmericanSpanish American IndianSri LankanSubsaharan AfricanSudaneseSwedishSwissSyrianTaiwaneseThaiTlingit-HaidaTohono O'OdhamTonganTrinidadian and TobagonianTsimshianTurkishU.S. Virgin IslanderUgandanUkrainianUruguayanUteVenezuelanVietnameseWelshWest IndianYakamaYaquiYugoslavianYumanYup'ikZimbabwean
Immigration
NonimmigrantsImmigrantsAfghanistanAfricaAlbaniaArgentinaArmeniaAsiaAustraliaAustriaBahamasBangladeshBarbadosBelarusBelgiumBelizeBoliviaBosnia and HerzegovinaBrazilBulgariaBurma/MyanmarCabo VerdeCambodiaCameroonCanadaCaribbeanCentral AmericaChileChinaColombiaCongoCosta RicaCroatiaCubaCzechoslovakiaDenmarkDominicaDominican RepublicEastern AfricaEastern AsiaEastern EuropeEcuadorEgyptEl SalvadorEnglandEritreaEthiopiaEuropeFijiFranceGermanyGhanaGreeceGrenadaGuatemalaGuyanaHaitiHondurasHong KongHungaryIndiaIndonesiaIranIraqIrelandIsraelItalyJamaicaJapanJordanKazakhstanKenyaKoreaKuwaitLaosLatin AmericaLatviaLebanonLiberiaLithuaniaMalaysiaMexicoMicronesiaMiddle AfricaMoldovaMoroccoNepalNetherlandsNicaraguaNigeriaNorth AmericaNorth MacedoniaNorthern AfricaNorthern EuropeNorwayOceaniaPakistanPanamaPeruPhilippinesPolandPortugalRomaniaRussiaSaudi ArabiaScotlandSenegalSerbiaSierra LeoneSingaporeSomaliaSouth AfricaSouth AmericaSouth Central AsiaSouth Eastern AsiaSouthern EuropeSpainSri LankaSt. Vincent and the GrenadinesSudanSwedenSwitzerlandSyriaTaiwanThailandTrinidad and TobagoTurkeyUgandaUkraineUruguayUzbekistanVenezuelaVietnamWest IndiesWestern AfricaWestern AsiaWestern EuropeYemenZaireZimbabweAzores
In Labor Force | Age 35-44
Income
Poverty
Unemployment
Labor Participation
Family Structure
Vehicle Availability
Education Level
Disability

In Labor Force | Age 35-44 Comparison

Osage

Immigrants from England

Tragic
Fair
82.9%
IN LABOR FORCE | AGE 35-44
0.0/ 100
METRIC RATING
282nd/ 347
METRIC RANK
84.2%
IN LABOR FORCE | AGE 35-44
25.0/ 100
METRIC RATING
196th/ 347
METRIC RANK

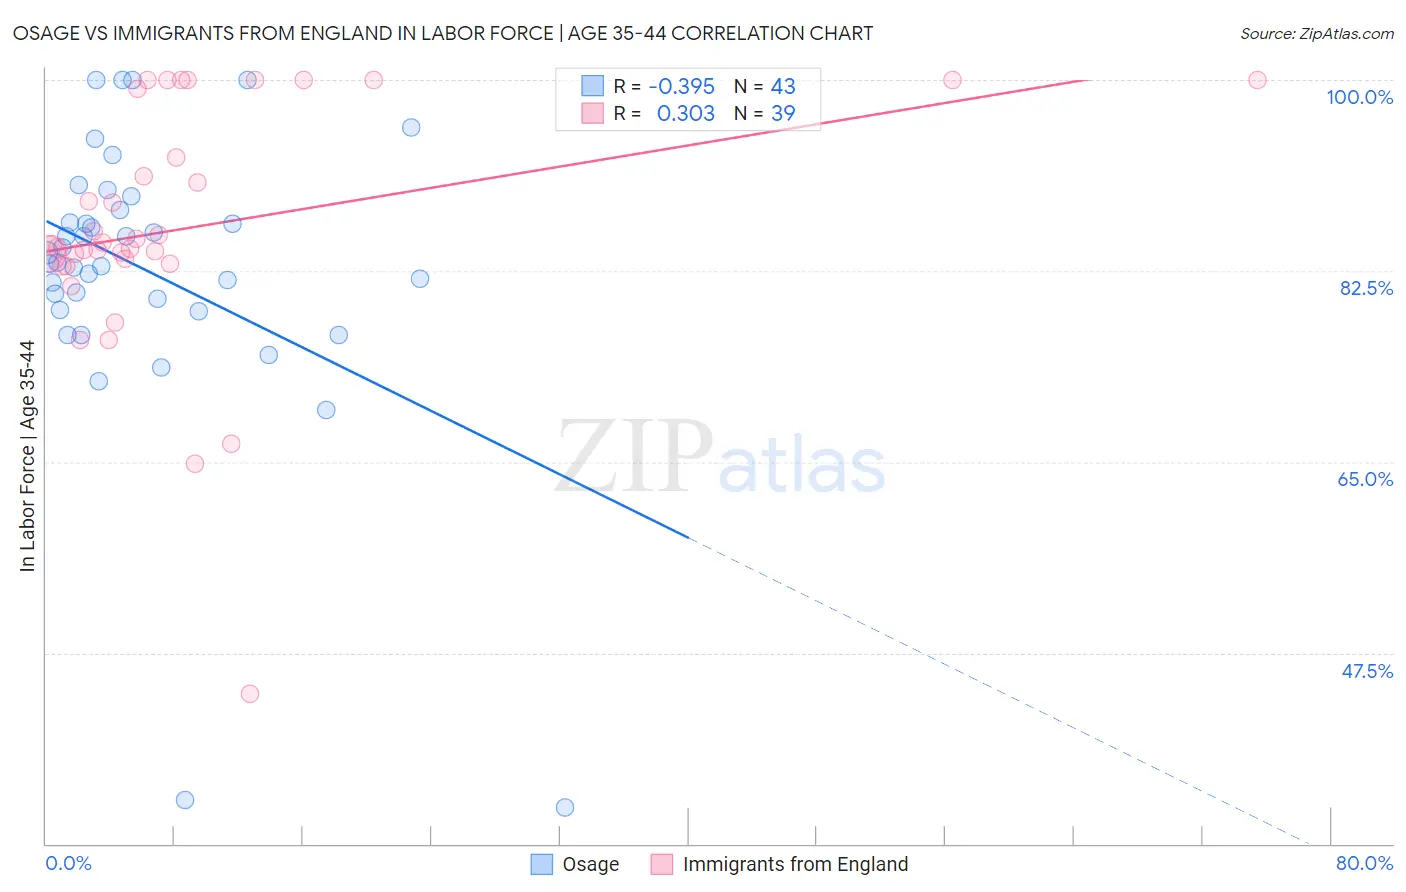
Osage vs Immigrants from England In Labor Force | Age 35-44 Correlation Chart

The statistical analysis conducted on geographies consisting of 91,795,339 people shows a mild negative correlation between the proportion of Osage and labor force participation rate among population between the ages 35 and 44 in the United States with a correlation coefficient (R) of -0.395 and weighted average of 82.9%. Similarly, the statistical analysis conducted on geographies consisting of 391,745,799 people shows a mild positive correlation between the proportion of Immigrants from England and labor force participation rate among population between the ages 35 and 44 in the United States with a correlation coefficient (R) of 0.303 and weighted average of 84.2%, a difference of 1.5%.
Osage vs Immigrants from England In Labor Force | Age 35-44

In Labor Force | Age 35-44 Correlation Summary

MeasurementOsageImmigrants from England
Minimum33.3%43.8%
Maximum100.0%100.0%
Range66.7%56.2%
Mean82.5%86.5%
Median83.3%84.9%
Interquartile 25% (IQ1)78.9%83.2%
Interquartile 75% (IQ3)88.1%99.3%
Interquartile Range (IQR)9.3%16.1%
Standard Deviation (Sample)13.2%11.5%
Standard Deviation (Population)13.0%11.3%

Similar Demographics by In Labor Force | Age 35-44

Demographics Similar to Osage by In Labor Force | Age 35-44

In terms of in labor force | age 35-44, the demographic groups most similar to Osage are Immigrants from Guatemala (82.9%, a difference of 0.0%), Immigrants from Dominican Republic (82.9%, a difference of 0.010%), Fijian (82.9%, a difference of 0.020%), Immigrants from Bangladesh (82.9%, a difference of 0.020%), and Immigrants from Belize (82.9%, a difference of 0.030%).
DemographicsRating | RankIn Labor Force | Age 35-44
Hawaiians
0.0
/100
|
#275
Tragic
83.2%
Delaware
0.0
/100
|
#276
Tragic
83.2%
Samoans
0.0
/100
|
#277
Tragic
83.2%
Belizeans
0.0
/100
|
#278
Tragic
83.1%
Immigrants | Micronesia
0.0
/100
|
#279
Tragic
83.1%
Dominicans
0.0
/100
|
#280
Tragic
83.1%
Guatemalans
0.0
/100
|
#281
Tragic
83.0%
Osage
0.0
/100
|
#282
Tragic
82.9%
Immigrants | Guatemala
0.0
/100
|
#283
Tragic
82.9%
Immigrants | Dominican Republic
0.0
/100
|
#284
Tragic
82.9%
Fijians
0.0
/100
|
#285
Tragic
82.9%
Immigrants | Bangladesh
0.0
/100
|
#286
Tragic
82.9%
Immigrants | Belize
0.0
/100
|
#287
Tragic
82.9%
Puget Sound Salish
0.0
/100
|
#288
Tragic
82.9%
Chippewa
0.0
/100
|
#289
Tragic
82.9%

Demographics Similar to Immigrants from England by In Labor Force | Age 35-44

In terms of in labor force | age 35-44, the demographic groups most similar to Immigrants from England are Immigrants from Western Europe (84.2%, a difference of 0.0%), Hungarian (84.2%, a difference of 0.010%), Immigrants from Indonesia (84.2%, a difference of 0.010%), Immigrants from Caribbean (84.2%, a difference of 0.010%), and Ecuadorian (84.2%, a difference of 0.010%).
DemographicsRating | RankIn Labor Force | Age 35-44
Immigrants | Denmark
33.7
/100
|
#189
Fair
84.3%
Portuguese
31.9
/100
|
#190
Fair
84.3%
Immigrants | Philippines
27.9
/100
|
#191
Fair
84.2%
Immigrants | Vietnam
27.4
/100
|
#192
Fair
84.2%
Hungarians
26.8
/100
|
#193
Fair
84.2%
Immigrants | Indonesia
25.7
/100
|
#194
Fair
84.2%
Immigrants | Caribbean
25.7
/100
|
#195
Fair
84.2%
Immigrants | England
25.0
/100
|
#196
Fair
84.2%
Immigrants | Western Europe
24.7
/100
|
#197
Fair
84.2%
Ecuadorians
24.0
/100
|
#198
Fair
84.2%
Syrians
23.2
/100
|
#199
Fair
84.2%
Moroccans
23.2
/100
|
#200
Fair
84.2%
British
23.0
/100
|
#201
Fair
84.2%
Immigrants | Uzbekistan
22.8
/100
|
#202
Fair
84.2%
Immigrants | South Eastern Asia
22.4
/100
|
#203
Fair
84.2%