Kenyan vs Guyanese In Labor Force | Age 25-29

COMPARE

Kenyan
Race
Ancestry
AfghanAfricanAlaska NativeAlaskan AthabascanAlbanianAleutAlsatianAmericanApacheArabArapahoArgentineanArmenianAssyrian/Chaldean/SyriacAustralianAustrianBahamianBangladeshiBarbadianBasqueBelgianBelizeanBermudanBhutaneseBlackfeetBolivianBrazilianBritishBritish West IndianBulgarianBurmeseCajunCambodianCanadianCape VerdeanCarpatho RusynCelticCentral AmericanCentral American IndianCherokeeCheyenneChickasawChileanChineseChippewaChoctawColombianColvilleComancheCosta RicanCreeCreekCroatianCrowCubanCypriotCzechCzechoslovakianDanishDelawareDominicanDutchDutch West IndianEastern EuropeanEcuadorianEgyptianEnglishEstonianEthiopianEuropeanFijianFilipinoFinnishFrenchFrench American IndianFrench CanadianGermanGerman RussianGhanaianGreekGuamanian/ChamorroGuatemalanHaitianHmongHonduranHopiHoumaHungarianIcelanderIndian (Asian)IndonesianInupiatIranianIraqiIrishIroquoisIsraeliItalianJamaicanJapaneseJordanianKenyanKiowaKoreanLaotianLatvianLebaneseLiberianLithuanianLumbeeLuxembourgerMacedonianMalaysianMalteseMarshalleseMenomineeMexicanMexican American IndianMongolianMoroccanNative HawaiianNavajoNepaleseNew ZealanderNicaraguanNigerianNorthern EuropeanNorwegianOkinawanOsageOttawaPaiutePakistaniPalestinianPanamanianParaguayanPennsylvania GermanPeruvianPimaPolishPortuguesePotawatomiPuebloPuerto RicanPuget Sound SalishRomanianRussianSalvadoranSamoanScandinavianScotch-IrishScottishSeminoleSenegaleseSerbianShoshoneSierra LeoneanSiouxSlavicSlovakSloveneSomaliSouth AfricanSouth AmericanSouth American IndianSoviet UnionSpaniardSpanishSpanish AmericanSpanish American IndianSri LankanSubsaharan AfricanSudaneseSwedishSwissSyrianTaiwaneseThaiTlingit-HaidaTohono O'OdhamTonganTrinidadian and TobagonianTsimshianTurkishU.S. Virgin IslanderUgandanUkrainianUruguayanUteVenezuelanVietnameseWelshWest IndianYakamaYaquiYugoslavianYumanYup'ikZimbabwean
Immigration
NonimmigrantsImmigrantsAfghanistanAfricaAlbaniaArgentinaArmeniaAsiaAustraliaAustriaBahamasBangladeshBarbadosBelarusBelgiumBelizeBoliviaBosnia and HerzegovinaBrazilBulgariaBurma/MyanmarCabo VerdeCambodiaCameroonCanadaCaribbeanCentral AmericaChileChinaColombiaCongoCosta RicaCroatiaCubaCzechoslovakiaDenmarkDominicaDominican RepublicEastern AfricaEastern AsiaEastern EuropeEcuadorEgyptEl SalvadorEnglandEritreaEthiopiaEuropeFijiFranceGermanyGhanaGreeceGrenadaGuatemalaGuyanaHaitiHondurasHong KongHungaryIndiaIndonesiaIranIraqIrelandIsraelItalyJamaicaJapanJordanKazakhstanKenyaKoreaKuwaitLaosLatin AmericaLatviaLebanonLiberiaLithuaniaMalaysiaMexicoMicronesiaMiddle AfricaMoldovaMoroccoNepalNetherlandsNicaraguaNigeriaNorth AmericaNorth MacedoniaNorthern AfricaNorthern EuropeNorwayOceaniaPakistanPanamaPeruPhilippinesPolandPortugalRomaniaRussiaSaudi ArabiaScotlandSenegalSerbiaSierra LeoneSingaporeSomaliaSouth AfricaSouth AmericaSouth Central AsiaSouth Eastern AsiaSouthern EuropeSpainSri LankaSt. Vincent and the GrenadinesSudanSwedenSwitzerlandSyriaTaiwanThailandTrinidad and TobagoTurkeyUgandaUkraineUruguayUzbekistanVenezuelaVietnamWest IndiesWestern AfricaWestern AsiaWestern EuropeYemenZaireZimbabweAzores
Guyanese
Race
Ancestry
AfghanAfricanAlaska NativeAlaskan AthabascanAlbanianAleutAlsatianAmericanApacheArabArapahoArgentineanArmenianAssyrian/Chaldean/SyriacAustralianAustrianBahamianBangladeshiBarbadianBasqueBelgianBelizeanBermudanBhutaneseBlackfeetBolivianBrazilianBritishBritish West IndianBulgarianBurmeseCajunCambodianCanadianCape VerdeanCarpatho RusynCelticCentral AmericanCentral American IndianCherokeeCheyenneChickasawChileanChineseChippewaChoctawColombianColvilleComancheCosta RicanCreeCreekCroatianCrowCubanCypriotCzechCzechoslovakianDanishDelawareDominicanDutchDutch West IndianEastern EuropeanEcuadorianEgyptianEnglishEstonianEthiopianEuropeanFijianFilipinoFinnishFrenchFrench American IndianFrench CanadianGermanGerman RussianGhanaianGreekGuamanian/ChamorroGuatemalanGuyaneseHaitianHmongHonduranHopiHoumaHungarianIcelanderIndian (Asian)IndonesianInupiatIranianIraqiIrishIroquoisIsraeliItalianJamaicanJapaneseJordanianKiowaKoreanLaotianLatvianLebaneseLiberianLithuanianLumbeeLuxembourgerMacedonianMalaysianMalteseMarshalleseMenomineeMexicanMexican American IndianMongolianMoroccanNative HawaiianNavajoNepaleseNew ZealanderNicaraguanNigerianNorthern EuropeanNorwegianOkinawanOsageOttawaPaiutePakistaniPalestinianPanamanianParaguayanPennsylvania GermanPeruvianPimaPolishPortuguesePotawatomiPuebloPuerto RicanPuget Sound SalishRomanianRussianSalvadoranSamoanScandinavianScotch-IrishScottishSeminoleSenegaleseSerbianShoshoneSierra LeoneanSiouxSlavicSlovakSloveneSomaliSouth AfricanSouth AmericanSouth American IndianSoviet UnionSpaniardSpanishSpanish AmericanSpanish American IndianSri LankanSubsaharan AfricanSudaneseSwedishSwissSyrianTaiwaneseThaiTlingit-HaidaTohono O'OdhamTonganTrinidadian and TobagonianTsimshianTurkishU.S. Virgin IslanderUgandanUkrainianUruguayanUteVenezuelanVietnameseWelshWest IndianYakamaYaquiYugoslavianYumanYup'ikZimbabwean
Immigration
NonimmigrantsImmigrantsAfghanistanAfricaAlbaniaArgentinaArmeniaAsiaAustraliaAustriaBahamasBangladeshBarbadosBelarusBelgiumBelizeBoliviaBosnia and HerzegovinaBrazilBulgariaBurma/MyanmarCabo VerdeCambodiaCameroonCanadaCaribbeanCentral AmericaChileChinaColombiaCongoCosta RicaCroatiaCubaCzechoslovakiaDenmarkDominicaDominican RepublicEastern AfricaEastern AsiaEastern EuropeEcuadorEgyptEl SalvadorEnglandEritreaEthiopiaEuropeFijiFranceGermanyGhanaGreeceGrenadaGuatemalaGuyanaHaitiHondurasHong KongHungaryIndiaIndonesiaIranIraqIrelandIsraelItalyJamaicaJapanJordanKazakhstanKenyaKoreaKuwaitLaosLatin AmericaLatviaLebanonLiberiaLithuaniaMalaysiaMexicoMicronesiaMiddle AfricaMoldovaMoroccoNepalNetherlandsNicaraguaNigeriaNorth AmericaNorth MacedoniaNorthern AfricaNorthern EuropeNorwayOceaniaPakistanPanamaPeruPhilippinesPolandPortugalRomaniaRussiaSaudi ArabiaScotlandSenegalSerbiaSierra LeoneSingaporeSomaliaSouth AfricaSouth AmericaSouth Central AsiaSouth Eastern AsiaSouthern EuropeSpainSri LankaSt. Vincent and the GrenadinesSudanSwedenSwitzerlandSyriaTaiwanThailandTrinidad and TobagoTurkeyUgandaUkraineUruguayUzbekistanVenezuelaVietnamWest IndiesWestern AfricaWestern AsiaWestern EuropeYemenZaireZimbabweAzores
In Labor Force | Age 25-29
Income
Poverty
Unemployment
Labor Participation
Family Structure
Vehicle Availability
Education Level
Disability

In Labor Force | Age 25-29 Comparison

Kenyans

Guyanese

Exceptional
Tragic
85.4%
IN LABOR FORCE | AGE 25-29
99.0/ 100
METRIC RATING
71st/ 347
METRIC RANK
83.0%
IN LABOR FORCE | AGE 25-29
0.0/ 100
METRIC RATING
287th/ 347
METRIC RANK

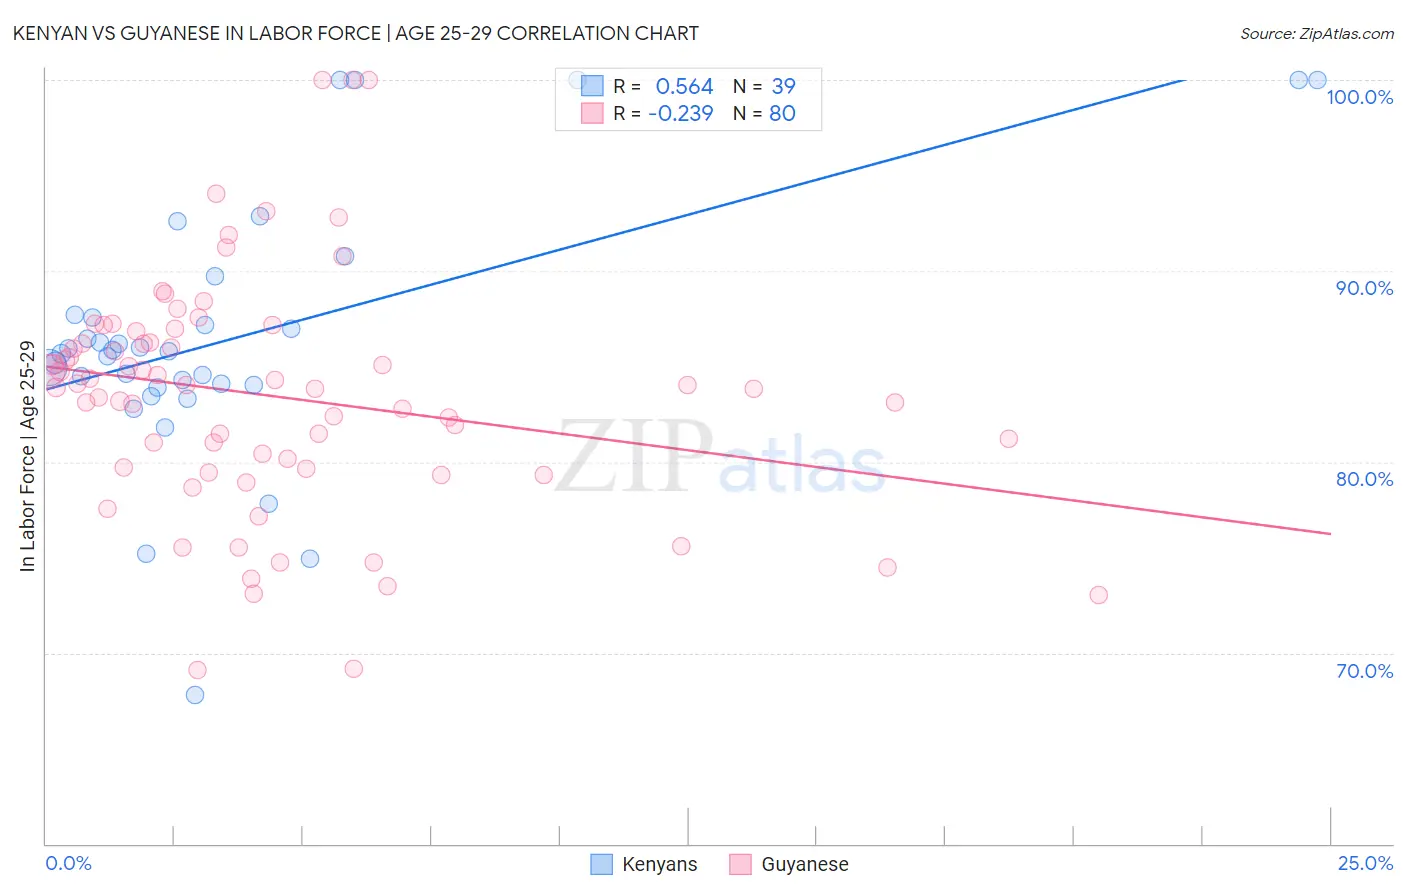
Kenyan vs Guyanese In Labor Force | Age 25-29 Correlation Chart

The statistical analysis conducted on geographies consisting of 168,218,619 people shows a substantial positive correlation between the proportion of Kenyans and labor force participation rate among population between the ages 25 and 29 in the United States with a correlation coefficient (R) of 0.564 and weighted average of 85.4%. Similarly, the statistical analysis conducted on geographies consisting of 176,912,088 people shows a weak negative correlation between the proportion of Guyanese and labor force participation rate among population between the ages 25 and 29 in the United States with a correlation coefficient (R) of -0.239 and weighted average of 83.0%, a difference of 2.8%.
Kenyan vs Guyanese In Labor Force | Age 25-29

In Labor Force | Age 25-29 Correlation Summary

MeasurementKenyanGuyanese
Minimum67.8%69.1%
Maximum100.0%100.0%
Range32.2%30.9%
Mean86.6%83.4%
Median85.8%84.0%
Interquartile 25% (IQ1)84.1%79.7%
Interquartile 75% (IQ3)87.7%86.5%
Interquartile Range (IQR)3.6%6.8%
Standard Deviation (Sample)6.9%6.2%
Standard Deviation (Population)6.8%6.2%

Similar Demographics by In Labor Force | Age 25-29

Demographics Similar to Kenyans by In Labor Force | Age 25-29

In terms of in labor force | age 25-29, the demographic groups most similar to Kenyans are Menominee (85.4%, a difference of 0.020%), Immigrants from Sweden (85.4%, a difference of 0.020%), Immigrants from Australia (85.3%, a difference of 0.020%), Russian (85.3%, a difference of 0.030%), and Immigrants from Turkey (85.4%, a difference of 0.040%).
DemographicsRating | RankIn Labor Force | Age 25-29
Immigrants | Italy
99.3
/100
|
#64
Exceptional
85.4%
Immigrants | Czechoslovakia
99.3
/100
|
#65
Exceptional
85.4%
Immigrants | Scotland
99.3
/100
|
#66
Exceptional
85.4%
Immigrants | Turkey
99.2
/100
|
#67
Exceptional
85.4%
Immigrants | Cameroon
99.2
/100
|
#68
Exceptional
85.4%
Menominee
99.1
/100
|
#69
Exceptional
85.4%
Immigrants | Sweden
99.1
/100
|
#70
Exceptional
85.4%
Kenyans
99.0
/100
|
#71
Exceptional
85.4%
Immigrants | Australia
98.9
/100
|
#72
Exceptional
85.3%
Russians
98.8
/100
|
#73
Exceptional
85.3%
Soviet Union
98.5
/100
|
#74
Exceptional
85.3%
Brazilians
98.3
/100
|
#75
Exceptional
85.3%
Germans
98.1
/100
|
#76
Exceptional
85.3%
Immigrants | South Central Asia
97.9
/100
|
#77
Exceptional
85.2%
Immigrants | Egypt
97.7
/100
|
#78
Exceptional
85.2%

Demographics Similar to Guyanese by In Labor Force | Age 25-29

In terms of in labor force | age 25-29, the demographic groups most similar to Guyanese are Mexican American Indian (83.0%, a difference of 0.020%), Belizean (83.1%, a difference of 0.030%), Ottawa (83.0%, a difference of 0.030%), Immigrants from Micronesia (83.0%, a difference of 0.050%), and Nicaraguan (83.1%, a difference of 0.070%).
DemographicsRating | RankIn Labor Force | Age 25-29
Dominicans
0.0
/100
|
#280
Tragic
83.2%
Immigrants | Dominican Republic
0.0
/100
|
#281
Tragic
83.1%
Americans
0.0
/100
|
#282
Tragic
83.1%
Immigrants | Azores
0.0
/100
|
#283
Tragic
83.1%
Nicaraguans
0.0
/100
|
#284
Tragic
83.1%
Belizeans
0.0
/100
|
#285
Tragic
83.1%
Mexican American Indians
0.0
/100
|
#286
Tragic
83.0%
Guyanese
0.0
/100
|
#287
Tragic
83.0%
Ottawa
0.0
/100
|
#288
Tragic
83.0%
Immigrants | Micronesia
0.0
/100
|
#289
Tragic
83.0%
Immigrants | Bangladesh
0.0
/100
|
#290
Tragic
83.0%
Hawaiians
0.0
/100
|
#291
Tragic
83.0%
Immigrants | Guyana
0.0
/100
|
#292
Tragic
83.0%
Immigrants | Latin America
0.0
/100
|
#293
Tragic
82.9%
Nepalese
0.0
/100
|
#294
Tragic
82.9%