Indian (Asian) vs Immigrants from the Azores In Labor Force | Age 20-24
COMPARE
Indian (Asian)
Immigrants from the Azores
In Labor Force | Age 20-24
In Labor Force | Age 20-24 Comparison
Indians (Asian)
Immigrants from the Azores
71.9%
IN LABOR FORCE | AGE 20-24
0.0/ 100
METRIC RATING
314th/ 347
METRIC RANK
77.2%
IN LABOR FORCE | AGE 20-24
100.0/ 100
METRIC RATING
53rd/ 347
METRIC RANK
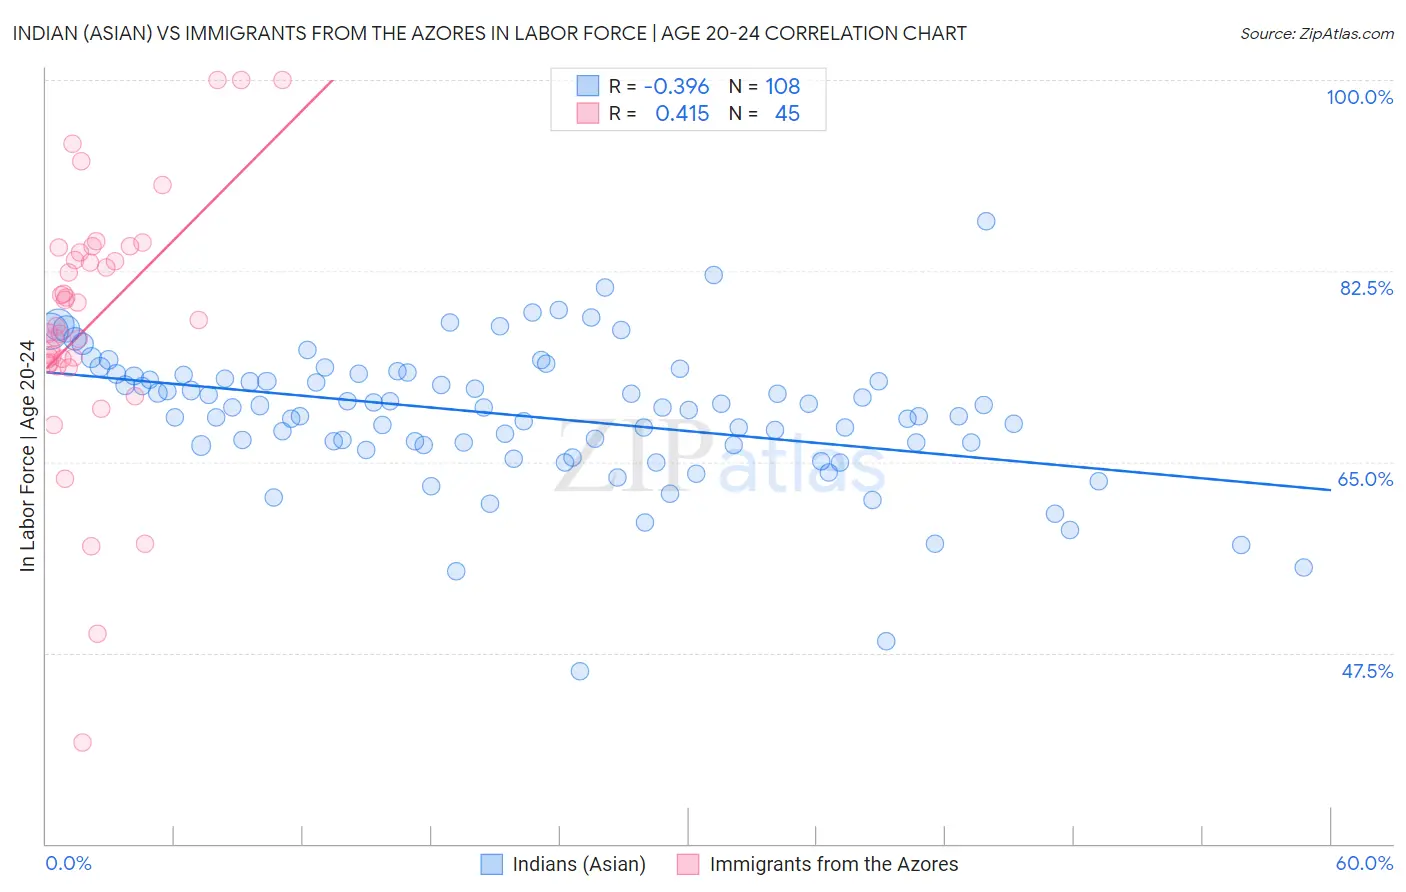
Indian (Asian) vs Immigrants from the Azores In Labor Force | Age 20-24 Correlation Chart
The statistical analysis conducted on geographies consisting of 495,002,226 people shows a mild negative correlation between the proportion of Indians (Asian) and labor force participation rate among population between the ages 20 and 24 in the United States with a correlation coefficient (R) of -0.396 and weighted average of 71.9%. Similarly, the statistical analysis conducted on geographies consisting of 46,250,012 people shows a moderate positive correlation between the proportion of Immigrants from the Azores and labor force participation rate among population between the ages 20 and 24 in the United States with a correlation coefficient (R) of 0.415 and weighted average of 77.2%, a difference of 7.4%.
In Labor Force | Age 20-24 Correlation Summary
| Measurement | Indian (Asian) | Immigrants from the Azores |
| Minimum | 45.8% | 39.3% |
| Maximum | 87.0% | 100.0% |
| Range | 41.2% | 60.7% |
| Mean | 69.2% | 78.0% |
| Median | 70.0% | 78.0% |
| Interquartile 25% (IQ1) | 66.6% | 74.0% |
| Interquartile 75% (IQ3) | 72.9% | 84.4% |
| Interquartile Range (IQR) | 6.4% | 10.4% |
| Standard Deviation (Sample) | 6.3% | 11.9% |
| Standard Deviation (Population) | 6.3% | 11.8% |
Similar Demographics by In Labor Force | Age 20-24
Demographics Similar to Indians (Asian) by In Labor Force | Age 20-24
In terms of in labor force | age 20-24, the demographic groups most similar to Indians (Asian) are Immigrants from Dominica (71.9%, a difference of 0.010%), Immigrants from Caribbean (71.9%, a difference of 0.060%), Immigrants from Iran (71.8%, a difference of 0.090%), Apache (72.0%, a difference of 0.13%), and Immigrants from Eastern Asia (71.8%, a difference of 0.13%).
| Demographics | Rating | Rank | In Labor Force | Age 20-24 |
| Immigrants | Ecuador | 0.0 /100 | #307 | Tragic 72.3% |
| Soviet Union | 0.0 /100 | #308 | Tragic 72.3% |
| Tsimshian | 0.0 /100 | #309 | Tragic 72.3% |
| Immigrants | Cuba | 0.0 /100 | #310 | Tragic 72.0% |
| Apache | 0.0 /100 | #311 | Tragic 72.0% |
| Immigrants | Caribbean | 0.0 /100 | #312 | Tragic 71.9% |
| Immigrants | Dominica | 0.0 /100 | #313 | Tragic 71.9% |
| Indians (Asian) | 0.0 /100 | #314 | Tragic 71.9% |
| Immigrants | Iran | 0.0 /100 | #315 | Tragic 71.8% |
| Immigrants | Eastern Asia | 0.0 /100 | #316 | Tragic 71.8% |
| Immigrants | Armenia | 0.0 /100 | #317 | Tragic 71.7% |
| Immigrants | Hong Kong | 0.0 /100 | #318 | Tragic 71.6% |
| Immigrants | Israel | 0.0 /100 | #319 | Tragic 71.6% |
| Trinidadians and Tobagonians | 0.0 /100 | #320 | Tragic 71.5% |
| Immigrants | Taiwan | 0.0 /100 | #321 | Tragic 71.5% |
Demographics Similar to Immigrants from the Azores by In Labor Force | Age 20-24
In terms of in labor force | age 20-24, the demographic groups most similar to Immigrants from the Azores are Indonesian (77.2%, a difference of 0.010%), Croatian (77.2%, a difference of 0.020%), Malaysian (77.2%, a difference of 0.030%), Chinese (77.3%, a difference of 0.070%), and Serbian (77.3%, a difference of 0.080%).
| Demographics | Rating | Rank | In Labor Force | Age 20-24 |
| Samoans | 100.0 /100 | #46 | Exceptional 77.4% |
| Ethiopians | 100.0 /100 | #47 | Exceptional 77.3% |
| Serbians | 100.0 /100 | #48 | Exceptional 77.3% |
| Chinese | 100.0 /100 | #49 | Exceptional 77.3% |
| Malaysians | 100.0 /100 | #50 | Exceptional 77.2% |
| Croatians | 100.0 /100 | #51 | Exceptional 77.2% |
| Indonesians | 100.0 /100 | #52 | Exceptional 77.2% |
| Immigrants | Azores | 100.0 /100 | #53 | Exceptional 77.2% |
| Celtics | 99.9 /100 | #54 | Exceptional 77.1% |
| Immigrants | Liberia | 99.9 /100 | #55 | Exceptional 77.1% |
| Europeans | 99.9 /100 | #56 | Exceptional 77.1% |
| Chippewa | 99.9 /100 | #57 | Exceptional 77.1% |
| Hawaiians | 99.9 /100 | #58 | Exceptional 77.0% |
| Scotch-Irish | 99.9 /100 | #59 | Exceptional 77.0% |
| Kenyans | 99.9 /100 | #60 | Exceptional 77.0% |