Immigrants from Portugal vs Immigrants from the Azores In Labor Force | Age 20-24

COMPARE

Immigrants from Portugal
Race
Ancestry
AfghanAfricanAlaska NativeAlaskan AthabascanAlbanianAleutAlsatianAmericanApacheArabArapahoArgentineanArmenianAssyrian/Chaldean/SyriacAustralianAustrianBahamianBangladeshiBarbadianBasqueBelgianBelizeanBermudanBhutaneseBlackfeetBolivianBrazilianBritishBritish West IndianBulgarianBurmeseCajunCambodianCanadianCape VerdeanCarpatho RusynCelticCentral AmericanCentral American IndianCherokeeCheyenneChickasawChileanChineseChippewaChoctawColombianColvilleComancheCosta RicanCreeCreekCroatianCrowCubanCypriotCzechCzechoslovakianDanishDelawareDominicanDutchDutch West IndianEastern EuropeanEcuadorianEgyptianEnglishEstonianEthiopianEuropeanFijianFilipinoFinnishFrenchFrench American IndianFrench CanadianGermanGerman RussianGhanaianGreekGuamanian/ChamorroGuatemalanGuyaneseHaitianHmongHonduranHopiHoumaHungarianIcelanderIndian (Asian)IndonesianInupiatIranianIraqiIrishIroquoisIsraeliItalianJamaicanJapaneseJordanianKenyanKiowaKoreanLaotianLatvianLebaneseLiberianLithuanianLumbeeLuxembourgerMacedonianMalaysianMalteseMarshalleseMenomineeMexicanMexican American IndianMongolianMoroccanNative HawaiianNavajoNepaleseNew ZealanderNicaraguanNigerianNorthern EuropeanNorwegianOkinawanOsageOttawaPaiutePakistaniPalestinianPanamanianParaguayanPennsylvania GermanPeruvianPimaPolishPortuguesePotawatomiPuebloPuerto RicanPuget Sound SalishRomanianRussianSalvadoranSamoanScandinavianScotch-IrishScottishSeminoleSenegaleseSerbianShoshoneSierra LeoneanSiouxSlavicSlovakSloveneSomaliSouth AfricanSouth AmericanSouth American IndianSoviet UnionSpaniardSpanishSpanish AmericanSpanish American IndianSri LankanSubsaharan AfricanSudaneseSwedishSwissSyrianTaiwaneseThaiTlingit-HaidaTohono O'OdhamTonganTrinidadian and TobagonianTsimshianTurkishU.S. Virgin IslanderUgandanUkrainianUruguayanUteVenezuelanVietnameseWelshWest IndianYakamaYaquiYugoslavianYumanYup'ikZimbabwean
Immigration
NonimmigrantsImmigrantsAfghanistanAfricaAlbaniaArgentinaArmeniaAsiaAustraliaAustriaBahamasBangladeshBarbadosBelarusBelgiumBelizeBoliviaBosnia and HerzegovinaBrazilBulgariaBurma/MyanmarCabo VerdeCambodiaCameroonCanadaCaribbeanCentral AmericaChileChinaColombiaCongoCosta RicaCroatiaCubaCzechoslovakiaDenmarkDominicaDominican RepublicEastern AfricaEastern AsiaEastern EuropeEcuadorEgyptEl SalvadorEnglandEritreaEthiopiaEuropeFijiFranceGermanyGhanaGreeceGrenadaGuatemalaGuyanaHaitiHondurasHong KongHungaryIndiaIndonesiaIranIraqIrelandIsraelItalyJamaicaJapanJordanKazakhstanKenyaKoreaKuwaitLaosLatin AmericaLatviaLebanonLiberiaLithuaniaMalaysiaMexicoMicronesiaMiddle AfricaMoldovaMoroccoNepalNetherlandsNicaraguaNigeriaNorth AmericaNorth MacedoniaNorthern AfricaNorthern EuropeNorwayOceaniaPakistanPanamaPeruPhilippinesPolandPortugalRomaniaRussiaSaudi ArabiaScotlandSenegalSerbiaSierra LeoneSingaporeSomaliaSouth AfricaSouth AmericaSouth Central AsiaSouth Eastern AsiaSouthern EuropeSpainSri LankaSt. Vincent and the GrenadinesSudanSwedenSwitzerlandSyriaTaiwanThailandTrinidad and TobagoTurkeyUgandaUkraineUruguayUzbekistanVenezuelaVietnamWest IndiesWestern AfricaWestern AsiaWestern EuropeYemenZaireZimbabwe
Immigrants from the Azores
Race
Ancestry
AfghanAfricanAlaska NativeAlaskan AthabascanAlbanianAleutAlsatianAmericanApacheArabArapahoArgentineanArmenianAssyrian/Chaldean/SyriacAustralianAustrianBahamianBangladeshiBarbadianBasqueBelgianBelizeanBermudanBhutaneseBlackfeetBolivianBrazilianBritishBritish West IndianBulgarianBurmeseCajunCambodianCanadianCape VerdeanCarpatho RusynCelticCentral AmericanCentral American IndianCherokeeCheyenneChickasawChileanChineseChippewaChoctawColombianColvilleComancheCosta RicanCreeCreekCroatianCrowCubanCypriotCzechCzechoslovakianDanishDelawareDominicanDutchDutch West IndianEastern EuropeanEcuadorianEgyptianEnglishEstonianEthiopianEuropeanFijianFilipinoFinnishFrenchFrench American IndianFrench CanadianGermanGerman RussianGhanaianGreekGuamanian/ChamorroGuatemalanGuyaneseHaitianHmongHonduranHopiHoumaHungarianIcelanderIndian (Asian)IndonesianInupiatIranianIraqiIrishIroquoisIsraeliItalianJamaicanJapaneseJordanianKenyanKiowaKoreanLaotianLatvianLebaneseLiberianLithuanianLumbeeLuxembourgerMacedonianMalaysianMalteseMarshalleseMenomineeMexicanMexican American IndianMongolianMoroccanNative HawaiianNavajoNepaleseNew ZealanderNicaraguanNigerianNorthern EuropeanNorwegianOkinawanOsageOttawaPaiutePakistaniPalestinianPanamanianParaguayanPennsylvania GermanPeruvianPimaPolishPortuguesePotawatomiPuebloPuerto RicanPuget Sound SalishRomanianRussianSalvadoranSamoanScandinavianScotch-IrishScottishSeminoleSenegaleseSerbianShoshoneSierra LeoneanSiouxSlavicSlovakSloveneSomaliSouth AfricanSouth AmericanSouth American IndianSoviet UnionSpaniardSpanishSpanish AmericanSpanish American IndianSri LankanSubsaharan AfricanSudaneseSwedishSwissSyrianTaiwaneseThaiTlingit-HaidaTohono O'OdhamTonganTrinidadian and TobagonianTsimshianTurkishU.S. Virgin IslanderUgandanUkrainianUruguayanUteVenezuelanVietnameseWelshWest IndianYakamaYaquiYugoslavianYumanYup'ikZimbabwean
Immigration
NonimmigrantsImmigrantsAfghanistanAfricaAlbaniaArgentinaArmeniaAsiaAustraliaAustriaBahamasBangladeshBarbadosBelarusBelgiumBelizeBoliviaBosnia and HerzegovinaBrazilBulgariaBurma/MyanmarCabo VerdeCambodiaCameroonCanadaCaribbeanCentral AmericaChileChinaColombiaCongoCosta RicaCroatiaCubaCzechoslovakiaDenmarkDominicaDominican RepublicEastern AfricaEastern AsiaEastern EuropeEcuadorEgyptEl SalvadorEnglandEritreaEthiopiaEuropeFijiFranceGermanyGhanaGreeceGrenadaGuatemalaGuyanaHaitiHondurasHong KongHungaryIndiaIndonesiaIranIraqIrelandIsraelItalyJamaicaJapanJordanKazakhstanKenyaKoreaKuwaitLaosLatin AmericaLatviaLebanonLiberiaLithuaniaMalaysiaMexicoMicronesiaMiddle AfricaMoldovaMoroccoNepalNetherlandsNicaraguaNigeriaNorth AmericaNorth MacedoniaNorthern AfricaNorthern EuropeNorwayOceaniaPakistanPanamaPeruPhilippinesPolandRomaniaRussiaSaudi ArabiaScotlandSenegalSerbiaSierra LeoneSingaporeSomaliaSouth AfricaSouth AmericaSouth Central AsiaSouth Eastern AsiaSouthern EuropeSpainSri LankaSt. Vincent and the GrenadinesSudanSwedenSwitzerlandSyriaTaiwanThailandTrinidad and TobagoTurkeyUgandaUkraineUruguayUzbekistanVenezuelaVietnamWest IndiesWestern AfricaWestern AsiaWestern EuropeYemenZaireZimbabweAzores
In Labor Force | Age 20-24
Income
Poverty
Unemployment
Labor Participation
Family Structure
Vehicle Availability
Education Level
Disability

In Labor Force | Age 20-24 Comparison

Immigrants from Portugal

Immigrants from the Azores

Exceptional
Exceptional
75.8%
IN LABOR FORCE | AGE 20-24
94.8/ 100
METRIC RATING
119th/ 347
METRIC RANK
77.2%
IN LABOR FORCE | AGE 20-24
100.0/ 100
METRIC RATING
53rd/ 347
METRIC RANK

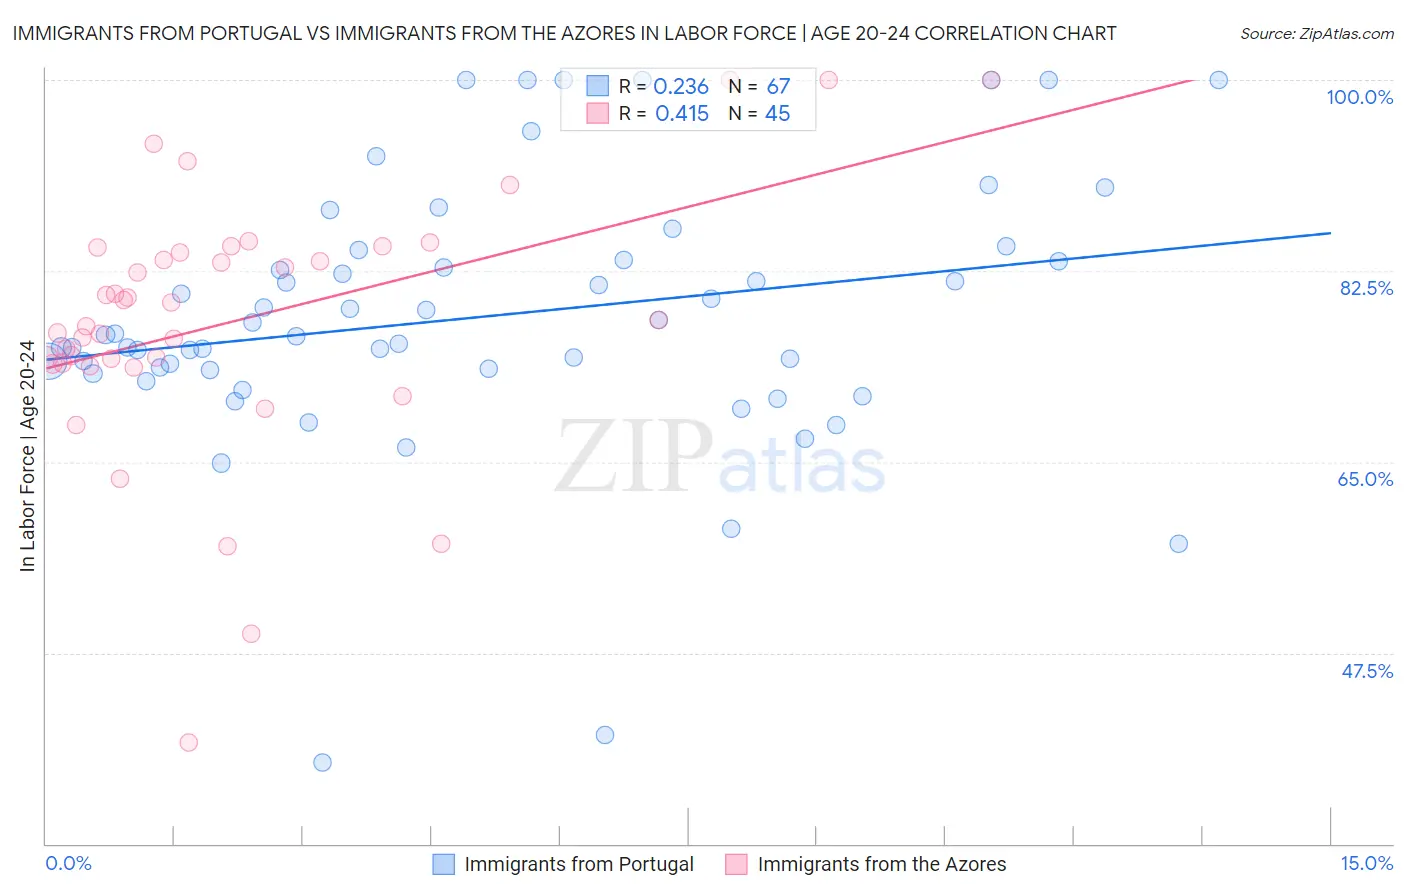
Immigrants from Portugal vs Immigrants from the Azores In Labor Force | Age 20-24 Correlation Chart

The statistical analysis conducted on geographies consisting of 174,703,744 people shows a weak positive correlation between the proportion of Immigrants from Portugal and labor force participation rate among population between the ages 20 and 24 in the United States with a correlation coefficient (R) of 0.236 and weighted average of 75.8%. Similarly, the statistical analysis conducted on geographies consisting of 46,250,012 people shows a moderate positive correlation between the proportion of Immigrants from the Azores and labor force participation rate among population between the ages 20 and 24 in the United States with a correlation coefficient (R) of 0.415 and weighted average of 77.2%, a difference of 1.8%.
Immigrants from Portugal vs Immigrants from the Azores In Labor Force | Age 20-24

In Labor Force | Age 20-24 Correlation Summary

MeasurementImmigrants from PortugalImmigrants from the Azores
Minimum37.5%39.3%
Maximum100.0%100.0%
Range62.5%60.7%
Mean78.3%78.0%
Median76.6%78.0%
Interquartile 25% (IQ1)73.5%74.0%
Interquartile 75% (IQ3)83.6%84.4%
Interquartile Range (IQR)10.1%10.4%
Standard Deviation (Sample)12.1%11.9%
Standard Deviation (Population)12.1%11.8%

Similar Demographics by In Labor Force | Age 20-24

Demographics Similar to Immigrants from Portugal by In Labor Force | Age 20-24

In terms of in labor force | age 20-24, the demographic groups most similar to Immigrants from Portugal are Spanish American (75.8%, a difference of 0.0%), Immigrants from North America (75.9%, a difference of 0.010%), Assyrian/Chaldean/Syriac (75.9%, a difference of 0.010%), Immigrants from Africa (75.8%, a difference of 0.010%), and Immigrants from Zimbabwe (75.9%, a difference of 0.020%).
DemographicsRating | RankIn Labor Force | Age 20-24
Immigrants | Canada
95.6
/100
|
#112
Exceptional
75.9%
Immigrants | Netherlands
95.3
/100
|
#113
Exceptional
75.9%
Immigrants | Zimbabwe
95.1
/100
|
#114
Exceptional
75.9%
Alaska Natives
95.1
/100
|
#115
Exceptional
75.9%
Immigrants | North America
95.0
/100
|
#116
Exceptional
75.9%
Assyrians/Chaldeans/Syriacs
94.9
/100
|
#117
Exceptional
75.9%
Spanish Americans
94.8
/100
|
#118
Exceptional
75.8%
Immigrants | Portugal
94.8
/100
|
#119
Exceptional
75.8%
Immigrants | Africa
94.6
/100
|
#120
Exceptional
75.8%
Immigrants | Serbia
94.3
/100
|
#121
Exceptional
75.8%
Pakistanis
94.1
/100
|
#122
Exceptional
75.8%
Immigrants | Bulgaria
94.1
/100
|
#123
Exceptional
75.8%
Immigrants | Sierra Leone
93.8
/100
|
#124
Exceptional
75.8%
Immigrants | Scotland
93.7
/100
|
#125
Exceptional
75.8%
Brazilians
93.0
/100
|
#126
Exceptional
75.8%

Demographics Similar to Immigrants from the Azores by In Labor Force | Age 20-24

In terms of in labor force | age 20-24, the demographic groups most similar to Immigrants from the Azores are Indonesian (77.2%, a difference of 0.010%), Croatian (77.2%, a difference of 0.020%), Malaysian (77.2%, a difference of 0.030%), Chinese (77.3%, a difference of 0.070%), and Serbian (77.3%, a difference of 0.080%).
DemographicsRating | RankIn Labor Force | Age 20-24
Samoans
100.0
/100
|
#46
Exceptional
77.4%
Ethiopians
100.0
/100
|
#47
Exceptional
77.3%
Serbians
100.0
/100
|
#48
Exceptional
77.3%
Chinese
100.0
/100
|
#49
Exceptional
77.3%
Malaysians
100.0
/100
|
#50
Exceptional
77.2%
Croatians
100.0
/100
|
#51
Exceptional
77.2%
Indonesians
100.0
/100
|
#52
Exceptional
77.2%
Immigrants | Azores
100.0
/100
|
#53
Exceptional
77.2%
Celtics
99.9
/100
|
#54
Exceptional
77.1%
Immigrants | Liberia
99.9
/100
|
#55
Exceptional
77.1%
Europeans
99.9
/100
|
#56
Exceptional
77.1%
Chippewa
99.9
/100
|
#57
Exceptional
77.1%
Hawaiians
99.9
/100
|
#58
Exceptional
77.0%
Scotch-Irish
99.9
/100
|
#59
Exceptional
77.0%
Kenyans
99.9
/100
|
#60
Exceptional
77.0%