Immigrants from Uganda vs Immigrants from Austria In Labor Force | Age 20-64

COMPARE

Immigrants from Uganda
Race
Ancestry
AfghanAfricanAlaska NativeAlaskan AthabascanAlbanianAleutAlsatianAmericanApacheArabArapahoArgentineanArmenianAssyrian/Chaldean/SyriacAustralianAustrianBahamianBangladeshiBarbadianBasqueBelgianBelizeanBermudanBhutaneseBlackfeetBolivianBrazilianBritishBritish West IndianBulgarianBurmeseCajunCambodianCanadianCape VerdeanCarpatho RusynCelticCentral AmericanCentral American IndianCherokeeCheyenneChickasawChileanChineseChippewaChoctawColombianColvilleComancheCosta RicanCreeCreekCroatianCrowCubanCypriotCzechCzechoslovakianDanishDelawareDominicanDutchDutch West IndianEastern EuropeanEcuadorianEgyptianEnglishEstonianEthiopianEuropeanFijianFilipinoFinnishFrenchFrench American IndianFrench CanadianGermanGerman RussianGhanaianGreekGuamanian/ChamorroGuatemalanGuyaneseHaitianHmongHonduranHopiHoumaHungarianIcelanderIndian (Asian)IndonesianInupiatIranianIraqiIrishIroquoisIsraeliItalianJamaicanJapaneseJordanianKenyanKiowaKoreanLaotianLatvianLebaneseLiberianLithuanianLumbeeLuxembourgerMacedonianMalaysianMalteseMarshalleseMenomineeMexicanMexican American IndianMongolianMoroccanNative HawaiianNavajoNepaleseNew ZealanderNicaraguanNigerianNorthern EuropeanNorwegianOkinawanOsageOttawaPaiutePakistaniPalestinianPanamanianParaguayanPennsylvania GermanPeruvianPimaPolishPortuguesePotawatomiPuebloPuerto RicanPuget Sound SalishRomanianRussianSalvadoranSamoanScandinavianScotch-IrishScottishSeminoleSenegaleseSerbianShoshoneSierra LeoneanSiouxSlavicSlovakSloveneSomaliSouth AfricanSouth AmericanSouth American IndianSoviet UnionSpaniardSpanishSpanish AmericanSpanish American IndianSri LankanSubsaharan AfricanSudaneseSwedishSwissSyrianTaiwaneseThaiTlingit-HaidaTohono O'OdhamTonganTrinidadian and TobagonianTsimshianTurkishU.S. Virgin IslanderUgandanUkrainianUruguayanUteVenezuelanVietnameseWelshWest IndianYakamaYaquiYugoslavianYumanYup'ikZimbabwean
Immigration
NonimmigrantsImmigrantsAfghanistanAfricaAlbaniaArgentinaArmeniaAsiaAustraliaBahamasBangladeshBarbadosBelarusBelgiumBelizeBoliviaBosnia and HerzegovinaBrazilBulgariaBurma/MyanmarCabo VerdeCambodiaCameroonCanadaCaribbeanCentral AmericaChileChinaColombiaCongoCosta RicaCroatiaCubaCzechoslovakiaDenmarkDominicaDominican RepublicEastern AfricaEastern AsiaEastern EuropeEcuadorEgyptEl SalvadorEnglandEritreaEthiopiaEuropeFijiFranceGermanyGhanaGreeceGrenadaGuatemalaGuyanaHaitiHondurasHong KongHungaryIndiaIndonesiaIranIraqIrelandIsraelItalyJamaicaJapanJordanKazakhstanKenyaKoreaKuwaitLaosLatin AmericaLatviaLebanonLiberiaLithuaniaMalaysiaMexicoMicronesiaMiddle AfricaMoldovaMoroccoNepalNetherlandsNicaraguaNigeriaNorth AmericaNorth MacedoniaNorthern AfricaNorthern EuropeNorwayOceaniaPakistanPanamaPeruPhilippinesPolandPortugalRomaniaRussiaSaudi ArabiaScotlandSenegalSerbiaSierra LeoneSingaporeSomaliaSouth AfricaSouth AmericaSouth Central AsiaSouth Eastern AsiaSouthern EuropeSpainSri LankaSt. Vincent and the GrenadinesSudanSwedenSwitzerlandSyriaTaiwanThailandTrinidad and TobagoTurkeyUgandaUkraineUruguayUzbekistanVenezuelaVietnamWest IndiesWestern AfricaWestern AsiaWestern EuropeYemenZaireZimbabweAzores
Immigrants from Austria
Race
Ancestry
AfghanAfricanAlaska NativeAlaskan AthabascanAlbanianAleutAlsatianAmericanApacheArabArapahoArgentineanArmenianAssyrian/Chaldean/SyriacAustralianAustrianBahamianBangladeshiBarbadianBasqueBelgianBelizeanBermudanBhutaneseBlackfeetBolivianBrazilianBritishBritish West IndianBulgarianBurmeseCajunCambodianCanadianCape VerdeanCarpatho RusynCelticCentral AmericanCentral American IndianCherokeeCheyenneChickasawChileanChineseChippewaChoctawColombianColvilleComancheCosta RicanCreeCreekCroatianCrowCubanCypriotCzechCzechoslovakianDanishDelawareDominicanDutchDutch West IndianEastern EuropeanEcuadorianEgyptianEnglishEstonianEthiopianEuropeanFijianFilipinoFinnishFrenchFrench American IndianFrench CanadianGermanGerman RussianGhanaianGreekGuamanian/ChamorroGuatemalanGuyaneseHaitianHmongHonduranHopiHoumaHungarianIcelanderIndian (Asian)IndonesianInupiatIranianIraqiIrishIroquoisIsraeliItalianJamaicanJapaneseJordanianKenyanKiowaKoreanLaotianLatvianLebaneseLiberianLithuanianLumbeeLuxembourgerMacedonianMalaysianMalteseMarshalleseMenomineeMexicanMexican American IndianMongolianMoroccanNative HawaiianNavajoNepaleseNew ZealanderNicaraguanNigerianNorthern EuropeanNorwegianOkinawanOsageOttawaPaiutePakistaniPalestinianPanamanianParaguayanPennsylvania GermanPeruvianPimaPolishPortuguesePotawatomiPuebloPuerto RicanPuget Sound SalishRomanianRussianSalvadoranSamoanScandinavianScotch-IrishScottishSeminoleSenegaleseSerbianShoshoneSierra LeoneanSiouxSlavicSlovakSloveneSomaliSouth AfricanSouth AmericanSouth American IndianSoviet UnionSpaniardSpanishSpanish AmericanSpanish American IndianSri LankanSubsaharan AfricanSudaneseSwedishSwissSyrianTaiwaneseThaiTlingit-HaidaTohono O'OdhamTonganTrinidadian and TobagonianTsimshianTurkishU.S. Virgin IslanderUgandanUkrainianUruguayanUteVenezuelanVietnameseWelshWest IndianYakamaYaquiYugoslavianYumanYup'ikZimbabwean
Immigration
NonimmigrantsImmigrantsAfghanistanAfricaAlbaniaArgentinaArmeniaAsiaAustraliaAustriaBahamasBangladeshBarbadosBelarusBelgiumBelizeBoliviaBosnia and HerzegovinaBrazilBulgariaBurma/MyanmarCabo VerdeCambodiaCameroonCanadaCaribbeanCentral AmericaChileChinaColombiaCongoCosta RicaCroatiaCubaCzechoslovakiaDenmarkDominicaDominican RepublicEastern AfricaEastern AsiaEastern EuropeEcuadorEgyptEl SalvadorEnglandEritreaEthiopiaEuropeFijiFranceGermanyGhanaGreeceGrenadaGuatemalaGuyanaHaitiHondurasHong KongHungaryIndiaIndonesiaIranIraqIrelandIsraelItalyJamaicaJapanJordanKazakhstanKenyaKoreaKuwaitLaosLatin AmericaLatviaLebanonLiberiaLithuaniaMalaysiaMexicoMicronesiaMiddle AfricaMoldovaMoroccoNepalNetherlandsNicaraguaNigeriaNorth AmericaNorth MacedoniaNorthern AfricaNorthern EuropeNorwayOceaniaPakistanPanamaPeruPhilippinesPolandPortugalRomaniaRussiaSaudi ArabiaScotlandSenegalSerbiaSierra LeoneSingaporeSomaliaSouth AfricaSouth AmericaSouth Central AsiaSouth Eastern AsiaSouthern EuropeSpainSri LankaSt. Vincent and the GrenadinesSudanSwedenSwitzerlandSyriaTaiwanThailandTrinidad and TobagoTurkeyUkraineUruguayUzbekistanVenezuelaVietnamWest IndiesWestern AfricaWestern AsiaWestern EuropeYemenZaireZimbabweAzores
In Labor Force | Age 20-64
Income
Poverty
Unemployment
Labor Participation
Family Structure
Vehicle Availability
Education Level
Disability

In Labor Force | Age 20-64 Comparison

Immigrants from Uganda

Immigrants from Austria

Exceptional
Fair
80.7%
IN LABOR FORCE | AGE 20-64
99.9/ 100
METRIC RATING
28th/ 347
METRIC RANK
79.4%
IN LABOR FORCE | AGE 20-64
23.7/ 100
METRIC RATING
195th/ 347
METRIC RANK

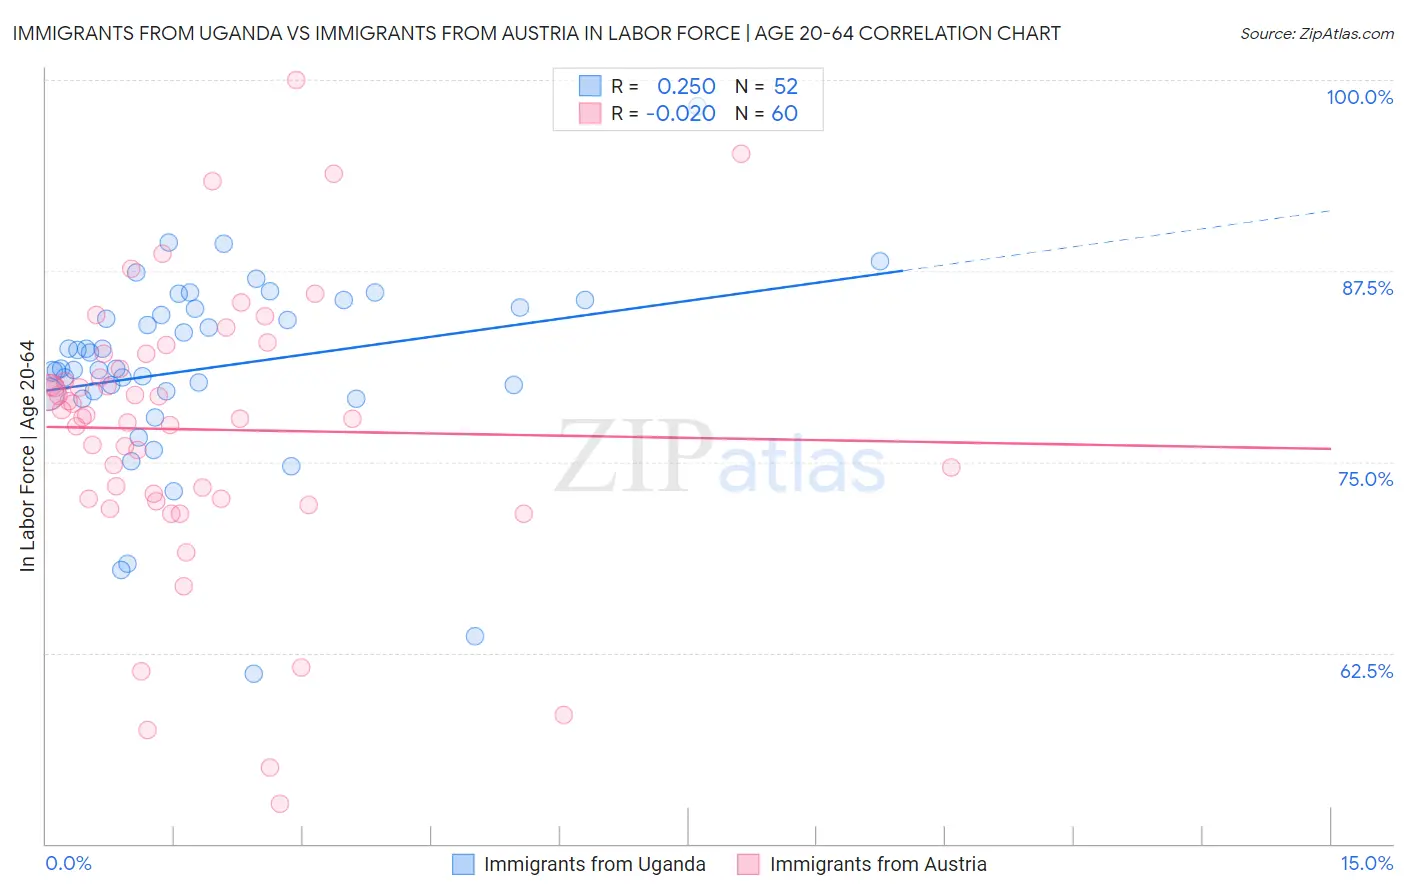
Immigrants from Uganda vs Immigrants from Austria In Labor Force | Age 20-64 Correlation Chart

The statistical analysis conducted on geographies consisting of 125,981,186 people shows a weak positive correlation between the proportion of Immigrants from Uganda and labor force participation rate among population between the ages 20 and 64 in the United States with a correlation coefficient (R) of 0.250 and weighted average of 80.7%. Similarly, the statistical analysis conducted on geographies consisting of 167,973,933 people shows no correlation between the proportion of Immigrants from Austria and labor force participation rate among population between the ages 20 and 64 in the United States with a correlation coefficient (R) of -0.020 and weighted average of 79.4%, a difference of 1.7%.
Immigrants from Uganda vs Immigrants from Austria In Labor Force | Age 20-64

In Labor Force | Age 20-64 Correlation Summary

MeasurementImmigrants from UgandaImmigrants from Austria
Minimum61.1%52.6%
Maximum98.3%100.0%
Range37.2%47.4%
Mean81.2%77.1%
Median81.1%78.0%
Interquartile 25% (IQ1)79.5%72.6%
Interquartile 75% (IQ3)85.0%81.6%
Interquartile Range (IQR)5.5%9.0%
Standard Deviation (Sample)6.3%9.1%
Standard Deviation (Population)6.3%9.0%

Similar Demographics by In Labor Force | Age 20-64

Demographics Similar to Immigrants from Uganda by In Labor Force | Age 20-64

In terms of in labor force | age 20-64, the demographic groups most similar to Immigrants from Uganda are Immigrants from Kenya (80.7%, a difference of 0.010%), Immigrants from South Central Asia (80.7%, a difference of 0.020%), Immigrants from North Macedonia (80.7%, a difference of 0.020%), Immigrants from Lithuania (80.7%, a difference of 0.040%), and Immigrants from Ireland (80.7%, a difference of 0.050%).
DemographicsRating | RankIn Labor Force | Age 20-64
Liberians
100.0
/100
|
#21
Exceptional
80.9%
Sudanese
100.0
/100
|
#22
Exceptional
80.8%
Immigrants | Bosnia and Herzegovina
100.0
/100
|
#23
Exceptional
80.8%
Immigrants | Morocco
100.0
/100
|
#24
Exceptional
80.8%
Kenyans
100.0
/100
|
#25
Exceptional
80.8%
Immigrants | Serbia
100.0
/100
|
#26
Exceptional
80.8%
Immigrants | Kenya
99.9
/100
|
#27
Exceptional
80.7%
Immigrants | Uganda
99.9
/100
|
#28
Exceptional
80.7%
Immigrants | South Central Asia
99.9
/100
|
#29
Exceptional
80.7%
Immigrants | North Macedonia
99.9
/100
|
#30
Exceptional
80.7%
Immigrants | Lithuania
99.9
/100
|
#31
Exceptional
80.7%
Immigrants | Ireland
99.9
/100
|
#32
Exceptional
80.7%
Chinese
99.9
/100
|
#33
Exceptional
80.7%
Immigrants | Brazil
99.9
/100
|
#34
Exceptional
80.7%
Immigrants | Poland
99.9
/100
|
#35
Exceptional
80.6%

Demographics Similar to Immigrants from Austria by In Labor Force | Age 20-64

In terms of in labor force | age 20-64, the demographic groups most similar to Immigrants from Austria are Immigrants from Thailand (79.4%, a difference of 0.010%), Ecuadorian (79.4%, a difference of 0.010%), Immigrants from Senegal (79.4%, a difference of 0.010%), Immigrants from Denmark (79.4%, a difference of 0.030%), and Indonesian (79.4%, a difference of 0.030%).
DemographicsRating | RankIn Labor Force | Age 20-64
Immigrants | Haiti
32.1
/100
|
#188
Fair
79.4%
Immigrants | El Salvador
30.9
/100
|
#189
Fair
79.4%
Immigrants | Syria
30.8
/100
|
#190
Fair
79.4%
Swiss
28.9
/100
|
#191
Fair
79.4%
Immigrants | Denmark
26.9
/100
|
#192
Fair
79.4%
Indonesians
26.1
/100
|
#193
Fair
79.4%
Immigrants | Thailand
24.8
/100
|
#194
Fair
79.4%
Immigrants | Austria
23.7
/100
|
#195
Fair
79.4%
Ecuadorians
23.1
/100
|
#196
Fair
79.4%
Immigrants | Senegal
22.5
/100
|
#197
Fair
79.4%
Immigrants | Laos
21.5
/100
|
#198
Fair
79.4%
Dutch
20.2
/100
|
#199
Fair
79.3%
Immigrants | Oceania
19.1
/100
|
#200
Poor
79.3%
Immigrants | Nicaragua
19.0
/100
|
#201
Poor
79.3%
Nicaraguans
18.3
/100
|
#202
Poor
79.3%