Immigrants from Trinidad and Tobago vs Navajo In Labor Force | Age > 16

COMPARE

Immigrants from Trinidad and Tobago
Race
Ancestry
AfghanAfricanAlaska NativeAlaskan AthabascanAlbanianAleutAlsatianAmericanApacheArabArapahoArgentineanArmenianAssyrian/Chaldean/SyriacAustralianAustrianBahamianBangladeshiBarbadianBasqueBelgianBelizeanBermudanBhutaneseBlackfeetBolivianBrazilianBritishBritish West IndianBulgarianBurmeseCajunCambodianCanadianCape VerdeanCarpatho RusynCelticCentral AmericanCentral American IndianCherokeeCheyenneChickasawChileanChineseChippewaChoctawColombianColvilleComancheCosta RicanCreeCreekCroatianCrowCubanCypriotCzechCzechoslovakianDanishDelawareDominicanDutchDutch West IndianEastern EuropeanEcuadorianEgyptianEnglishEstonianEthiopianEuropeanFijianFilipinoFinnishFrenchFrench American IndianFrench CanadianGermanGerman RussianGhanaianGreekGuamanian/ChamorroGuatemalanGuyaneseHaitianHmongHonduranHopiHoumaHungarianIcelanderIndian (Asian)IndonesianInupiatIranianIraqiIrishIroquoisIsraeliItalianJamaicanJapaneseJordanianKenyanKiowaKoreanLaotianLatvianLebaneseLiberianLithuanianLumbeeLuxembourgerMacedonianMalaysianMalteseMarshalleseMenomineeMexicanMexican American IndianMongolianMoroccanNative HawaiianNepaleseNew ZealanderNicaraguanNigerianNorthern EuropeanNorwegianOkinawanOsageOttawaPaiutePakistaniPalestinianPanamanianParaguayanPennsylvania GermanPeruvianPimaPolishPortuguesePotawatomiPuebloPuerto RicanPuget Sound SalishRomanianRussianSalvadoranSamoanScandinavianScotch-IrishScottishSeminoleSenegaleseSerbianShoshoneSierra LeoneanSiouxSlavicSlovakSloveneSomaliSouth AfricanSouth AmericanSouth American IndianSoviet UnionSpaniardSpanishSpanish AmericanSpanish American IndianSri LankanSubsaharan AfricanSudaneseSwedishSwissSyrianTaiwaneseThaiTlingit-HaidaTohono O'OdhamTonganTrinidadian and TobagonianTsimshianTurkishU.S. Virgin IslanderUgandanUkrainianUruguayanUteVenezuelanVietnameseWelshWest IndianYakamaYaquiYugoslavianYumanYup'ikZimbabwean
Immigration
NonimmigrantsImmigrantsAfghanistanAfricaAlbaniaArgentinaArmeniaAsiaAustraliaAustriaBahamasBangladeshBarbadosBelarusBelgiumBelizeBoliviaBosnia and HerzegovinaBrazilBulgariaBurma/MyanmarCabo VerdeCambodiaCameroonCanadaCaribbeanCentral AmericaChileChinaColombiaCongoCosta RicaCroatiaCubaCzechoslovakiaDenmarkDominicaDominican RepublicEastern AfricaEastern AsiaEastern EuropeEcuadorEgyptEl SalvadorEnglandEritreaEthiopiaEuropeFijiFranceGermanyGhanaGreeceGrenadaGuatemalaGuyanaHaitiHondurasHong KongHungaryIndiaIndonesiaIranIraqIrelandIsraelItalyJamaicaJapanJordanKazakhstanKenyaKoreaKuwaitLaosLatin AmericaLatviaLebanonLiberiaLithuaniaMalaysiaMexicoMicronesiaMiddle AfricaMoldovaMoroccoNepalNetherlandsNicaraguaNigeriaNorth AmericaNorth MacedoniaNorthern AfricaNorthern EuropeNorwayOceaniaPakistanPanamaPeruPhilippinesPolandPortugalRomaniaRussiaSaudi ArabiaScotlandSenegalSerbiaSierra LeoneSingaporeSomaliaSouth AfricaSouth AmericaSouth Central AsiaSouth Eastern AsiaSouthern EuropeSpainSri LankaSt. Vincent and the GrenadinesSudanSwedenSwitzerlandSyriaTaiwanThailandTrinidad and TobagoTurkeyUgandaUkraineUruguayUzbekistanVenezuelaVietnamWest IndiesWestern AfricaWestern AsiaWestern EuropeYemenZaireZimbabweAzores
Navajo
Race
Ancestry
AfghanAfricanAlaska NativeAlaskan AthabascanAlbanianAleutAlsatianAmericanApacheArabArapahoArgentineanArmenianAssyrian/Chaldean/SyriacAustralianAustrianBahamianBangladeshiBarbadianBasqueBelgianBelizeanBermudanBhutaneseBlackfeetBolivianBrazilianBritishBritish West IndianBulgarianBurmeseCajunCambodianCanadianCape VerdeanCarpatho RusynCelticCentral AmericanCentral American IndianCherokeeCheyenneChickasawChileanChineseChippewaChoctawColombianColvilleComancheCosta RicanCreeCreekCroatianCrowCubanCypriotCzechCzechoslovakianDanishDelawareDominicanDutchDutch West IndianEastern EuropeanEcuadorianEgyptianEnglishEstonianEthiopianEuropeanFijianFilipinoFinnishFrenchFrench American IndianFrench CanadianGermanGerman RussianGhanaianGreekGuamanian/ChamorroGuatemalanGuyaneseHaitianHmongHonduranHopiHoumaHungarianIcelanderIndian (Asian)IndonesianInupiatIranianIraqiIrishIroquoisIsraeliItalianJamaicanJapaneseJordanianKenyanKiowaKoreanLaotianLatvianLebaneseLiberianLithuanianLumbeeLuxembourgerMacedonianMalaysianMalteseMarshalleseMenomineeMexicanMexican American IndianMongolianMoroccanNative HawaiianNavajoNepaleseNew ZealanderNicaraguanNigerianNorthern EuropeanNorwegianOkinawanOsageOttawaPaiutePakistaniPalestinianPanamanianParaguayanPennsylvania GermanPeruvianPimaPolishPortuguesePotawatomiPuebloPuerto RicanPuget Sound SalishRomanianRussianSalvadoranSamoanScandinavianScotch-IrishScottishSeminoleSenegaleseSerbianShoshoneSierra LeoneanSiouxSlavicSlovakSloveneSomaliSouth AfricanSouth AmericanSouth American IndianSoviet UnionSpaniardSpanishSpanish AmericanSpanish American IndianSri LankanSubsaharan AfricanSudaneseSwedishSwissSyrianTaiwaneseThaiTlingit-HaidaTohono O'OdhamTonganTrinidadian and TobagonianTsimshianTurkishU.S. Virgin IslanderUgandanUkrainianUruguayanUteVenezuelanVietnameseWelshWest IndianYakamaYaquiYugoslavianYumanYup'ikZimbabwean
Immigration
NonimmigrantsImmigrantsAfghanistanAfricaAlbaniaArgentinaArmeniaAsiaAustraliaAustriaBahamasBangladeshBarbadosBelarusBelgiumBelizeBoliviaBosnia and HerzegovinaBrazilBulgariaBurma/MyanmarCabo VerdeCambodiaCameroonCanadaCaribbeanCentral AmericaChileChinaColombiaCongoCosta RicaCroatiaCubaCzechoslovakiaDenmarkDominicaDominican RepublicEastern AfricaEastern AsiaEastern EuropeEcuadorEgyptEl SalvadorEnglandEritreaEthiopiaEuropeFijiFranceGermanyGhanaGreeceGrenadaGuatemalaGuyanaHaitiHondurasHong KongHungaryIndiaIndonesiaIranIraqIrelandIsraelItalyJamaicaJapanJordanKazakhstanKenyaKoreaKuwaitLaosLatin AmericaLatviaLebanonLiberiaLithuaniaMalaysiaMexicoMicronesiaMiddle AfricaMoldovaMoroccoNepalNetherlandsNicaraguaNigeriaNorth AmericaNorth MacedoniaNorthern AfricaNorthern EuropeNorwayOceaniaPakistanPanamaPeruPhilippinesPolandPortugalRomaniaRussiaSaudi ArabiaScotlandSenegalSerbiaSierra LeoneSingaporeSomaliaSouth AfricaSouth AmericaSouth Central AsiaSouth Eastern AsiaSouthern EuropeSpainSri LankaSt. Vincent and the GrenadinesSudanSwedenSwitzerlandSyriaTaiwanThailandTurkeyUgandaUkraineUruguayUzbekistanVenezuelaVietnamWest IndiesWestern AfricaWestern AsiaWestern EuropeYemenZaireZimbabweAzores
In Labor Force | Age > 16
Income
Poverty
Unemployment
Labor Participation
Family Structure
Vehicle Availability
Education Level
Disability

In Labor Force | Age > 16 Comparison

Immigrants from Trinidad and Tobago

Navajo

Poor
Tragic
64.8%
IN LABOR FORCE | AGE > 16
15.6/ 100
METRIC RATING
209th/ 347
METRIC RANK
56.6%
IN LABOR FORCE | AGE > 16
0.0/ 100
METRIC RATING
347th/ 347
METRIC RANK

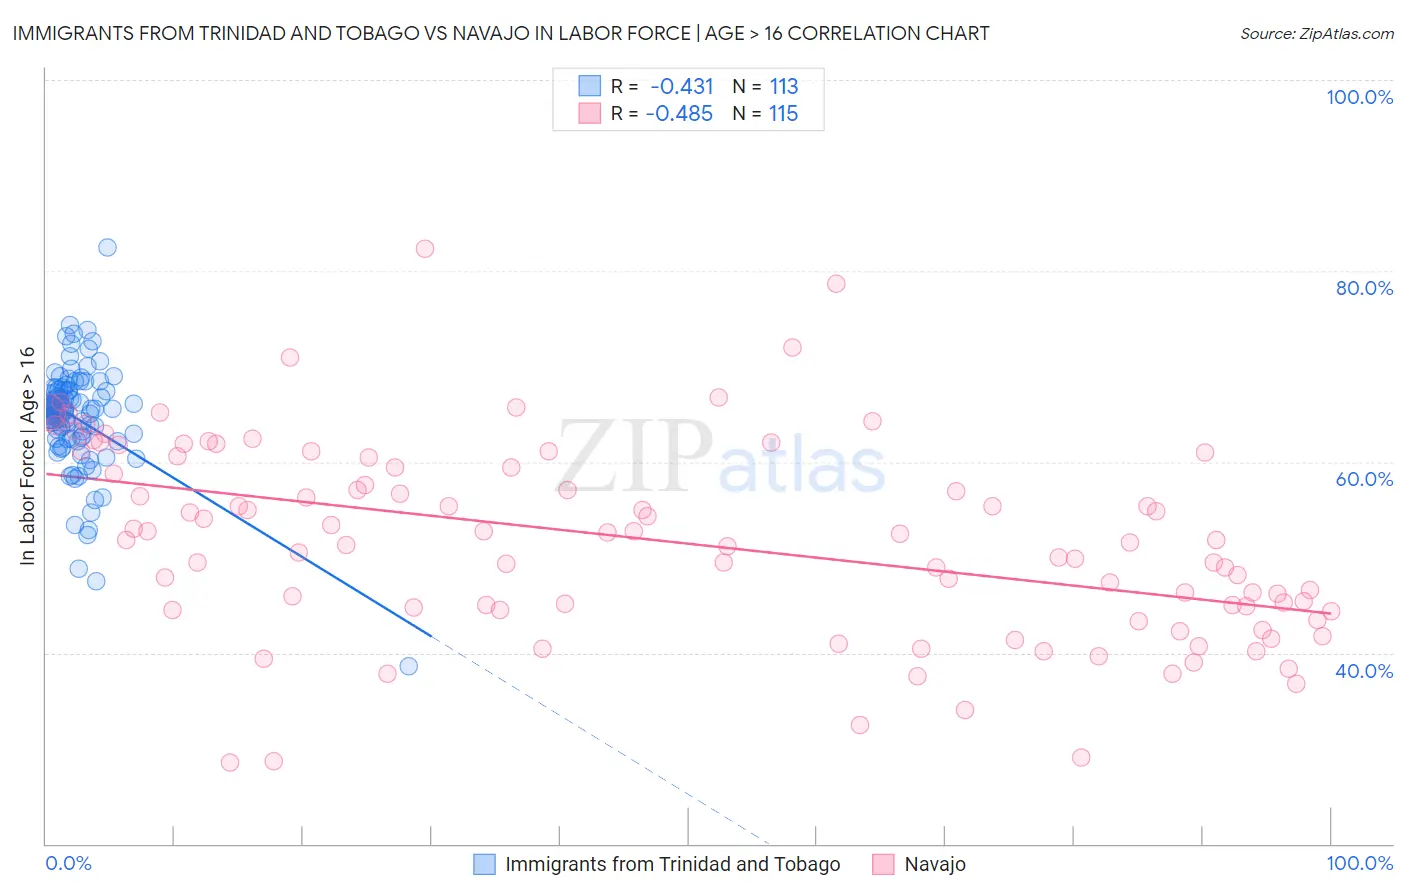
Immigrants from Trinidad and Tobago vs Navajo In Labor Force | Age > 16 Correlation Chart

The statistical analysis conducted on geographies consisting of 223,535,582 people shows a moderate negative correlation between the proportion of Immigrants from Trinidad and Tobago and labor force participation rate among population ages 16 and over in the United States with a correlation coefficient (R) of -0.431 and weighted average of 64.8%. Similarly, the statistical analysis conducted on geographies consisting of 224,852,646 people shows a moderate negative correlation between the proportion of Navajo and labor force participation rate among population ages 16 and over in the United States with a correlation coefficient (R) of -0.485 and weighted average of 56.6%, a difference of 14.5%.
Immigrants from Trinidad and Tobago vs Navajo In Labor Force | Age > 16

In Labor Force | Age > 16 Correlation Summary

MeasurementImmigrants from Trinidad and TobagoNavajo
Minimum38.6%28.5%
Maximum82.4%82.3%
Range43.8%53.8%
Mean64.6%51.7%
Median65.5%51.8%
Interquartile 25% (IQ1)62.5%44.5%
Interquartile 75% (IQ3)67.4%60.5%
Interquartile Range (IQR)4.9%16.0%
Standard Deviation (Sample)5.6%10.3%
Standard Deviation (Population)5.6%10.2%

Similar Demographics by In Labor Force | Age > 16

Demographics Similar to Immigrants from Trinidad and Tobago by In Labor Force | Age > 16

In terms of in labor force | age > 16, the demographic groups most similar to Immigrants from Trinidad and Tobago are Belizean (64.8%, a difference of 0.010%), Immigrants from Latin America (64.8%, a difference of 0.020%), Immigrants from Denmark (64.8%, a difference of 0.020%), Fijian (64.8%, a difference of 0.030%), and Lithuanian (64.8%, a difference of 0.040%).
DemographicsRating | RankIn Labor Force | Age > 16
Immigrants | Belgium
19.4
/100
|
#202
Poor
64.9%
Russians
18.8
/100
|
#203
Poor
64.9%
Slovenes
18.7
/100
|
#204
Poor
64.9%
Jamaicans
18.7
/100
|
#205
Poor
64.9%
Lithuanians
17.4
/100
|
#206
Poor
64.8%
Immigrants | Latin America
16.4
/100
|
#207
Poor
64.8%
Belizeans
16.2
/100
|
#208
Poor
64.8%
Immigrants | Trinidad and Tobago
15.6
/100
|
#209
Poor
64.8%
Immigrants | Denmark
14.7
/100
|
#210
Poor
64.8%
Fijians
14.1
/100
|
#211
Poor
64.8%
Alaskan Athabascans
13.9
/100
|
#212
Poor
64.8%
Maltese
13.8
/100
|
#213
Poor
64.8%
Estonians
13.1
/100
|
#214
Poor
64.8%
Immigrants | Czechoslovakia
12.3
/100
|
#215
Poor
64.8%
Belgians
11.4
/100
|
#216
Poor
64.7%

Demographics Similar to Navajo by In Labor Force | Age > 16

In terms of in labor force | age > 16, the demographic groups most similar to Navajo are Lumbee (56.8%, a difference of 0.31%), Tohono O'odham (57.2%, a difference of 1.2%), Pima (57.4%, a difference of 1.5%), Yuman (57.8%, a difference of 2.2%), and Puerto Rican (58.1%, a difference of 2.7%).
DemographicsRating | RankIn Labor Force | Age > 16
Paiute
0.0
/100
|
#333
Tragic
60.7%
Apache
0.0
/100
|
#334
Tragic
60.7%
Natives/Alaskans
0.0
/100
|
#335
Tragic
60.6%
Menominee
0.0
/100
|
#336
Tragic
60.6%
Colville
0.0
/100
|
#337
Tragic
59.8%
Immigrants | Yemen
0.0
/100
|
#338
Tragic
59.6%
Houma
0.0
/100
|
#339
Tragic
59.5%
Pueblo
0.0
/100
|
#340
Tragic
59.3%
Hopi
0.0
/100
|
#341
Tragic
58.4%
Puerto Ricans
0.0
/100
|
#342
Tragic
58.1%
Yuman
0.0
/100
|
#343
Tragic
57.8%
Pima
0.0
/100
|
#344
Tragic
57.4%
Tohono O'odham
0.0
/100
|
#345
Tragic
57.2%
Lumbee
0.0
/100
|
#346
Tragic
56.8%
Navajo
0.0
/100
|
#347
Tragic
56.6%