Immigrants from Sri Lanka vs Tlingit-Haida In Labor Force | Age 25-29

COMPARE

Immigrants from Sri Lanka
Race
Ancestry
AfghanAfricanAlaska NativeAlaskan AthabascanAlbanianAleutAlsatianAmericanApacheArabArapahoArgentineanArmenianAssyrian/Chaldean/SyriacAustralianAustrianBahamianBangladeshiBarbadianBasqueBelgianBelizeanBermudanBhutaneseBlackfeetBolivianBrazilianBritishBritish West IndianBulgarianBurmeseCajunCambodianCanadianCape VerdeanCarpatho RusynCelticCentral AmericanCentral American IndianCherokeeCheyenneChickasawChileanChineseChippewaChoctawColombianColvilleComancheCosta RicanCreeCreekCroatianCrowCubanCypriotCzechCzechoslovakianDanishDelawareDominicanDutchDutch West IndianEastern EuropeanEcuadorianEgyptianEnglishEstonianEthiopianEuropeanFijianFilipinoFinnishFrenchFrench American IndianFrench CanadianGermanGerman RussianGhanaianGreekGuamanian/ChamorroGuatemalanGuyaneseHaitianHmongHonduranHopiHoumaHungarianIcelanderIndian (Asian)IndonesianInupiatIranianIraqiIrishIroquoisIsraeliItalianJamaicanJapaneseJordanianKenyanKiowaKoreanLaotianLatvianLebaneseLiberianLithuanianLumbeeLuxembourgerMacedonianMalaysianMalteseMarshalleseMenomineeMexicanMexican American IndianMongolianMoroccanNative HawaiianNavajoNepaleseNew ZealanderNicaraguanNigerianNorthern EuropeanNorwegianOkinawanOsageOttawaPaiutePakistaniPalestinianPanamanianParaguayanPennsylvania GermanPeruvianPimaPolishPortuguesePotawatomiPuebloPuerto RicanPuget Sound SalishRomanianRussianSalvadoranSamoanScandinavianScotch-IrishScottishSeminoleSenegaleseSerbianShoshoneSierra LeoneanSiouxSlavicSlovakSloveneSomaliSouth AfricanSouth AmericanSouth American IndianSoviet UnionSpaniardSpanishSpanish AmericanSpanish American IndianSri LankanSubsaharan AfricanSudaneseSwedishSwissSyrianTaiwaneseThaiTohono O'OdhamTonganTrinidadian and TobagonianTsimshianTurkishU.S. Virgin IslanderUgandanUkrainianUruguayanUteVenezuelanVietnameseWelshWest IndianYakamaYaquiYugoslavianYumanYup'ikZimbabwean
Immigration
NonimmigrantsImmigrantsAfghanistanAfricaAlbaniaArgentinaArmeniaAsiaAustraliaAustriaBahamasBangladeshBarbadosBelarusBelgiumBelizeBoliviaBosnia and HerzegovinaBrazilBulgariaBurma/MyanmarCabo VerdeCambodiaCameroonCanadaCaribbeanCentral AmericaChileChinaColombiaCongoCosta RicaCroatiaCubaCzechoslovakiaDenmarkDominicaDominican RepublicEastern AfricaEastern AsiaEastern EuropeEcuadorEgyptEl SalvadorEnglandEritreaEthiopiaEuropeFijiFranceGermanyGhanaGreeceGrenadaGuatemalaGuyanaHaitiHondurasHong KongHungaryIndiaIndonesiaIranIraqIrelandIsraelItalyJamaicaJapanJordanKazakhstanKenyaKoreaKuwaitLaosLatin AmericaLatviaLebanonLiberiaLithuaniaMalaysiaMexicoMicronesiaMiddle AfricaMoldovaMoroccoNepalNetherlandsNicaraguaNigeriaNorth AmericaNorth MacedoniaNorthern AfricaNorthern EuropeNorwayOceaniaPakistanPanamaPeruPhilippinesPolandPortugalRomaniaRussiaSaudi ArabiaScotlandSenegalSerbiaSierra LeoneSingaporeSomaliaSouth AfricaSouth AmericaSouth Central AsiaSouth Eastern AsiaSouthern EuropeSpainSri LankaSt. Vincent and the GrenadinesSudanSwedenSwitzerlandSyriaTaiwanThailandTrinidad and TobagoTurkeyUgandaUkraineUruguayUzbekistanVenezuelaVietnamWest IndiesWestern AfricaWestern AsiaWestern EuropeYemenZaireZimbabweAzores
Tlingit-Haida
Race
Ancestry
AfghanAfricanAlaska NativeAlaskan AthabascanAlbanianAleutAlsatianAmericanApacheArabArapahoArgentineanArmenianAssyrian/Chaldean/SyriacAustralianAustrianBahamianBangladeshiBarbadianBasqueBelgianBelizeanBermudanBhutaneseBlackfeetBolivianBrazilianBritishBritish West IndianBulgarianBurmeseCajunCambodianCanadianCape VerdeanCarpatho RusynCelticCentral AmericanCentral American IndianCherokeeCheyenneChickasawChileanChineseChippewaChoctawColombianColvilleComancheCosta RicanCreeCreekCroatianCrowCubanCypriotCzechCzechoslovakianDanishDelawareDominicanDutchDutch West IndianEastern EuropeanEcuadorianEgyptianEnglishEstonianEthiopianEuropeanFijianFilipinoFinnishFrenchFrench American IndianFrench CanadianGermanGerman RussianGhanaianGreekGuamanian/ChamorroGuatemalanGuyaneseHaitianHmongHonduranHopiHoumaHungarianIcelanderIndian (Asian)IndonesianInupiatIranianIraqiIrishIroquoisIsraeliItalianJamaicanJapaneseJordanianKenyanKiowaKoreanLaotianLatvianLebaneseLiberianLithuanianLumbeeLuxembourgerMacedonianMalaysianMalteseMarshalleseMenomineeMexicanMexican American IndianMongolianMoroccanNative HawaiianNavajoNepaleseNew ZealanderNicaraguanNigerianNorthern EuropeanNorwegianOkinawanOsageOttawaPaiutePakistaniPalestinianPanamanianParaguayanPennsylvania GermanPeruvianPimaPolishPortuguesePotawatomiPuebloPuerto RicanPuget Sound SalishRomanianRussianSalvadoranSamoanScandinavianScotch-IrishScottishSeminoleSenegaleseSerbianShoshoneSierra LeoneanSiouxSlavicSlovakSloveneSomaliSouth AfricanSouth AmericanSouth American IndianSoviet UnionSpaniardSpanishSpanish AmericanSpanish American IndianSri LankanSubsaharan AfricanSudaneseSwedishSwissSyrianTaiwaneseThaiTlingit-HaidaTohono O'OdhamTonganTrinidadian and TobagonianTsimshianTurkishU.S. Virgin IslanderUgandanUkrainianUruguayanUteVenezuelanVietnameseWelshWest IndianYakamaYaquiYugoslavianYumanYup'ikZimbabwean
Immigration
NonimmigrantsImmigrantsAfghanistanAfricaAlbaniaArgentinaArmeniaAsiaAustraliaAustriaBahamasBangladeshBarbadosBelarusBelgiumBelizeBoliviaBosnia and HerzegovinaBrazilBulgariaBurma/MyanmarCabo VerdeCambodiaCameroonCanadaCaribbeanCentral AmericaChileChinaColombiaCongoCosta RicaCroatiaCubaCzechoslovakiaDenmarkDominicaDominican RepublicEastern AfricaEastern AsiaEastern EuropeEcuadorEgyptEl SalvadorEnglandEritreaEthiopiaEuropeFijiFranceGermanyGhanaGreeceGrenadaGuatemalaGuyanaHaitiHondurasHong KongHungaryIndiaIndonesiaIranIraqIrelandIsraelItalyJamaicaJapanJordanKazakhstanKenyaKoreaKuwaitLaosLatin AmericaLatviaLebanonLiberiaLithuaniaMalaysiaMexicoMicronesiaMiddle AfricaMoldovaMoroccoNepalNetherlandsNicaraguaNigeriaNorth AmericaNorth MacedoniaNorthern AfricaNorthern EuropeNorwayOceaniaPakistanPanamaPeruPhilippinesPolandPortugalRomaniaRussiaSaudi ArabiaScotlandSenegalSerbiaSierra LeoneSingaporeSomaliaSouth AfricaSouth AmericaSouth Central AsiaSouth Eastern AsiaSouthern EuropeSpainSt. Vincent and the GrenadinesSudanSwedenSwitzerlandSyriaTaiwanThailandTrinidad and TobagoTurkeyUgandaUkraineUruguayUzbekistanVenezuelaVietnamWest IndiesWestern AfricaWestern AsiaWestern EuropeYemenZaireZimbabweAzores
In Labor Force | Age 25-29
Income
Poverty
Unemployment
Labor Participation
Family Structure
Vehicle Availability
Education Level
Disability

In Labor Force | Age 25-29 Comparison

Immigrants from Sri Lanka

Tlingit-Haida

Good
Poor
84.7%
IN LABOR FORCE | AGE 25-29
61.7/ 100
METRIC RATING
154th/ 347
METRIC RANK
84.4%
IN LABOR FORCE | AGE 25-29
19.3/ 100
METRIC RATING
197th/ 347
METRIC RANK

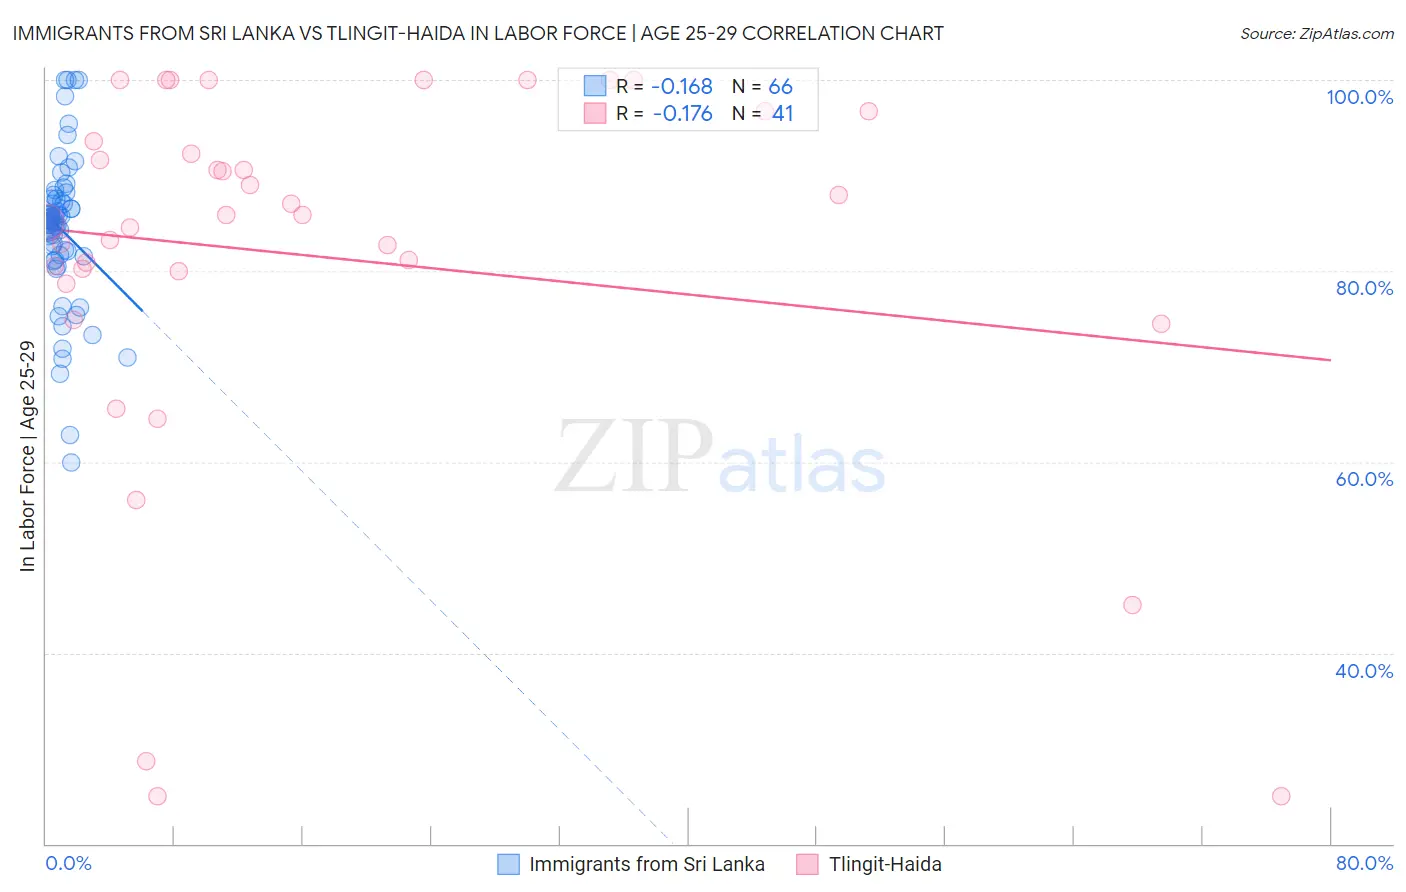
Immigrants from Sri Lanka vs Tlingit-Haida In Labor Force | Age 25-29 Correlation Chart

The statistical analysis conducted on geographies consisting of 149,692,146 people shows a poor negative correlation between the proportion of Immigrants from Sri Lanka and labor force participation rate among population between the ages 25 and 29 in the United States with a correlation coefficient (R) of -0.168 and weighted average of 84.7%. Similarly, the statistical analysis conducted on geographies consisting of 60,865,267 people shows a poor negative correlation between the proportion of Tlingit-Haida and labor force participation rate among population between the ages 25 and 29 in the United States with a correlation coefficient (R) of -0.176 and weighted average of 84.4%, a difference of 0.35%.
Immigrants from Sri Lanka vs Tlingit-Haida In Labor Force | Age 25-29

In Labor Force | Age 25-29 Correlation Summary

MeasurementImmigrants from Sri LankaTlingit-Haida
Minimum60.0%25.0%
Maximum100.0%100.0%
Range40.0%75.0%
Mean84.3%81.4%
Median85.2%85.8%
Interquartile 25% (IQ1)81.5%79.3%
Interquartile 75% (IQ3)87.6%95.2%
Interquartile Range (IQR)6.1%15.8%
Standard Deviation (Sample)8.0%19.9%
Standard Deviation (Population)7.9%19.6%

Similar Demographics by In Labor Force | Age 25-29

Demographics Similar to Immigrants from Sri Lanka by In Labor Force | Age 25-29

In terms of in labor force | age 25-29, the demographic groups most similar to Immigrants from Sri Lanka are Immigrants from Taiwan (84.7%, a difference of 0.0%), Indian (Asian) (84.7%, a difference of 0.0%), French (84.7%, a difference of 0.0%), Colombian (84.7%, a difference of 0.010%), and Immigrants from Pakistan (84.7%, a difference of 0.010%).
DemographicsRating | RankIn Labor Force | Age 25-29
Immigrants | Asia
68.2
/100
|
#147
Good
84.8%
Immigrants | England
65.2
/100
|
#148
Good
84.7%
Peruvians
64.7
/100
|
#149
Good
84.7%
Swiss
64.7
/100
|
#150
Good
84.7%
Colombians
62.8
/100
|
#151
Good
84.7%
Immigrants | Pakistan
62.7
/100
|
#152
Good
84.7%
Immigrants | Taiwan
62.2
/100
|
#153
Good
84.7%
Immigrants | Sri Lanka
61.7
/100
|
#154
Good
84.7%
Indians (Asian)
61.6
/100
|
#155
Good
84.7%
French
61.0
/100
|
#156
Good
84.7%
British
60.4
/100
|
#157
Good
84.7%
Immigrants | Ghana
60.2
/100
|
#158
Good
84.7%
Immigrants | Western Africa
60.1
/100
|
#159
Good
84.7%
Immigrants | Peru
58.6
/100
|
#160
Average
84.7%
Canadians
58.5
/100
|
#161
Average
84.7%

Demographics Similar to Tlingit-Haida by In Labor Force | Age 25-29

In terms of in labor force | age 25-29, the demographic groups most similar to Tlingit-Haida are Immigrants from South Eastern Asia (84.4%, a difference of 0.0%), Immigrants from Iraq (84.4%, a difference of 0.0%), Immigrants from Germany (84.4%, a difference of 0.010%), Portuguese (84.4%, a difference of 0.020%), and Immigrants from Israel (84.4%, a difference of 0.020%).
DemographicsRating | RankIn Labor Force | Age 25-29
Welsh
31.1
/100
|
#190
Fair
84.5%
Zimbabweans
28.7
/100
|
#191
Fair
84.5%
English
25.8
/100
|
#192
Fair
84.5%
South American Indians
25.0
/100
|
#193
Fair
84.5%
Portuguese
21.2
/100
|
#194
Fair
84.4%
Immigrants | Israel
20.8
/100
|
#195
Fair
84.4%
Immigrants | South Eastern Asia
19.5
/100
|
#196
Poor
84.4%
Tlingit-Haida
19.3
/100
|
#197
Poor
84.4%
Immigrants | Iraq
19.0
/100
|
#198
Poor
84.4%
Immigrants | Germany
18.3
/100
|
#199
Poor
84.4%
Immigrants | Kazakhstan
17.5
/100
|
#200
Poor
84.4%
Laotians
16.6
/100
|
#201
Poor
84.4%
Afghans
15.9
/100
|
#202
Poor
84.4%
Immigrants | Afghanistan
15.6
/100
|
#203
Poor
84.4%
Venezuelans
15.1
/100
|
#204
Poor
84.4%