Immigrants from Sri Lanka vs Immigrants from Vietnam In Labor Force | Age > 16

COMPARE

Immigrants from Sri Lanka
Race
Ancestry
AfghanAfricanAlaska NativeAlaskan AthabascanAlbanianAleutAlsatianAmericanApacheArabArapahoArgentineanArmenianAssyrian/Chaldean/SyriacAustralianAustrianBahamianBangladeshiBarbadianBasqueBelgianBelizeanBermudanBhutaneseBlackfeetBolivianBrazilianBritishBritish West IndianBulgarianBurmeseCajunCambodianCanadianCape VerdeanCarpatho RusynCelticCentral AmericanCentral American IndianCherokeeCheyenneChickasawChileanChineseChippewaChoctawColombianColvilleComancheCosta RicanCreeCreekCroatianCrowCubanCypriotCzechCzechoslovakianDanishDelawareDominicanDutchDutch West IndianEastern EuropeanEcuadorianEgyptianEnglishEstonianEthiopianEuropeanFijianFilipinoFinnishFrenchFrench American IndianFrench CanadianGermanGerman RussianGhanaianGreekGuamanian/ChamorroGuatemalanGuyaneseHaitianHmongHonduranHopiHoumaHungarianIcelanderIndian (Asian)IndonesianInupiatIranianIraqiIrishIroquoisIsraeliItalianJamaicanJapaneseJordanianKenyanKiowaKoreanLaotianLatvianLebaneseLiberianLithuanianLumbeeLuxembourgerMacedonianMalaysianMalteseMarshalleseMenomineeMexicanMexican American IndianMongolianMoroccanNative HawaiianNavajoNepaleseNew ZealanderNicaraguanNigerianNorthern EuropeanNorwegianOkinawanOsageOttawaPaiutePakistaniPalestinianPanamanianParaguayanPennsylvania GermanPeruvianPimaPolishPortuguesePotawatomiPuebloPuerto RicanPuget Sound SalishRomanianRussianSalvadoranSamoanScandinavianScotch-IrishScottishSeminoleSenegaleseSerbianShoshoneSierra LeoneanSiouxSlavicSlovakSloveneSomaliSouth AfricanSouth AmericanSouth American IndianSoviet UnionSpaniardSpanishSpanish AmericanSpanish American IndianSri LankanSubsaharan AfricanSudaneseSwedishSwissSyrianTaiwaneseThaiTlingit-HaidaTohono O'OdhamTonganTrinidadian and TobagonianTsimshianTurkishU.S. Virgin IslanderUgandanUkrainianUruguayanUteVenezuelanVietnameseWelshWest IndianYakamaYaquiYugoslavianYumanYup'ikZimbabwean
Immigration
NonimmigrantsImmigrantsAfghanistanAfricaAlbaniaArgentinaArmeniaAsiaAustraliaAustriaBahamasBangladeshBarbadosBelarusBelgiumBelizeBoliviaBosnia and HerzegovinaBrazilBulgariaBurma/MyanmarCabo VerdeCambodiaCameroonCanadaCaribbeanCentral AmericaChileChinaColombiaCongoCosta RicaCroatiaCubaCzechoslovakiaDenmarkDominicaDominican RepublicEastern AfricaEastern AsiaEastern EuropeEcuadorEgyptEl SalvadorEnglandEritreaEthiopiaEuropeFijiFranceGermanyGhanaGreeceGrenadaGuatemalaGuyanaHaitiHondurasHong KongHungaryIndiaIndonesiaIranIraqIrelandIsraelItalyJamaicaJapanJordanKazakhstanKenyaKoreaKuwaitLaosLatin AmericaLatviaLebanonLiberiaLithuaniaMalaysiaMexicoMicronesiaMiddle AfricaMoldovaMoroccoNepalNetherlandsNicaraguaNigeriaNorth AmericaNorth MacedoniaNorthern AfricaNorthern EuropeNorwayOceaniaPakistanPanamaPeruPhilippinesPolandPortugalRomaniaRussiaSaudi ArabiaScotlandSenegalSerbiaSierra LeoneSingaporeSomaliaSouth AfricaSouth AmericaSouth Central AsiaSouth Eastern AsiaSouthern EuropeSpainSri LankaSt. Vincent and the GrenadinesSudanSwedenSwitzerlandSyriaTaiwanThailandTrinidad and TobagoTurkeyUgandaUkraineUruguayUzbekistanVenezuelaWest IndiesWestern AfricaWestern AsiaWestern EuropeYemenZaireZimbabweAzores
Immigrants from Vietnam
Race
Ancestry
AfghanAfricanAlaska NativeAlaskan AthabascanAlbanianAleutAlsatianAmericanApacheArabArapahoArgentineanArmenianAssyrian/Chaldean/SyriacAustralianAustrianBahamianBangladeshiBarbadianBasqueBelgianBelizeanBermudanBhutaneseBlackfeetBolivianBrazilianBritishBritish West IndianBulgarianBurmeseCajunCambodianCanadianCape VerdeanCarpatho RusynCelticCentral AmericanCentral American IndianCherokeeCheyenneChickasawChileanChineseChippewaChoctawColombianColvilleComancheCosta RicanCreeCreekCroatianCrowCubanCypriotCzechCzechoslovakianDanishDelawareDominicanDutchDutch West IndianEastern EuropeanEcuadorianEgyptianEnglishEstonianEthiopianEuropeanFijianFilipinoFinnishFrenchFrench American IndianFrench CanadianGermanGerman RussianGhanaianGreekGuamanian/ChamorroGuatemalanGuyaneseHaitianHmongHonduranHopiHoumaHungarianIcelanderIndian (Asian)IndonesianInupiatIranianIraqiIrishIroquoisIsraeliItalianJamaicanJapaneseJordanianKenyanKiowaKoreanLaotianLatvianLebaneseLiberianLithuanianLumbeeLuxembourgerMacedonianMalaysianMalteseMarshalleseMenomineeMexicanMexican American IndianMongolianMoroccanNative HawaiianNavajoNepaleseNew ZealanderNicaraguanNigerianNorthern EuropeanNorwegianOkinawanOsageOttawaPaiutePakistaniPalestinianPanamanianParaguayanPennsylvania GermanPeruvianPimaPolishPortuguesePotawatomiPuebloPuerto RicanPuget Sound SalishRomanianRussianSalvadoranSamoanScandinavianScotch-IrishScottishSeminoleSenegaleseSerbianShoshoneSierra LeoneanSiouxSlavicSlovakSloveneSomaliSouth AfricanSouth AmericanSouth American IndianSoviet UnionSpaniardSpanishSpanish AmericanSpanish American IndianSri LankanSubsaharan AfricanSudaneseSwedishSwissSyrianTaiwaneseThaiTlingit-HaidaTohono O'OdhamTonganTrinidadian and TobagonianTsimshianTurkishU.S. Virgin IslanderUgandanUkrainianUruguayanUteVenezuelanVietnameseWelshWest IndianYakamaYaquiYugoslavianYumanYup'ikZimbabwean
Immigration
NonimmigrantsImmigrantsAfghanistanAfricaAlbaniaArgentinaArmeniaAsiaAustraliaAustriaBahamasBangladeshBarbadosBelarusBelgiumBelizeBoliviaBosnia and HerzegovinaBrazilBulgariaBurma/MyanmarCabo VerdeCambodiaCameroonCanadaCaribbeanCentral AmericaChileChinaColombiaCongoCosta RicaCroatiaCubaCzechoslovakiaDenmarkDominicaDominican RepublicEastern AfricaEastern AsiaEastern EuropeEcuadorEgyptEl SalvadorEnglandEritreaEthiopiaEuropeFijiFranceGermanyGhanaGreeceGrenadaGuatemalaGuyanaHaitiHondurasHong KongHungaryIndiaIndonesiaIranIraqIrelandIsraelItalyJamaicaJapanJordanKazakhstanKenyaKoreaKuwaitLaosLatin AmericaLatviaLebanonLiberiaLithuaniaMalaysiaMexicoMicronesiaMiddle AfricaMoldovaMoroccoNepalNetherlandsNicaraguaNigeriaNorth AmericaNorth MacedoniaNorthern AfricaNorthern EuropeNorwayOceaniaPakistanPanamaPeruPhilippinesPolandPortugalRomaniaRussiaSaudi ArabiaScotlandSenegalSerbiaSierra LeoneSingaporeSomaliaSouth AfricaSouth AmericaSouth Central AsiaSouth Eastern AsiaSouthern EuropeSpainSt. Vincent and the GrenadinesSudanSwedenSwitzerlandSyriaTaiwanThailandTrinidad and TobagoTurkeyUgandaUkraineUruguayUzbekistanVenezuelaVietnamWest IndiesWestern AfricaWestern AsiaWestern EuropeYemenZaireZimbabweAzores
In Labor Force | Age > 16
Income
Poverty
Unemployment
Labor Participation
Family Structure
Vehicle Availability
Education Level
Disability

In Labor Force | Age > 16 Comparison

Immigrants from Sri Lanka

Immigrants from Vietnam

Exceptional
Exceptional
66.5%
IN LABOR FORCE | AGE > 16
99.9/ 100
METRIC RATING
53rd/ 347
METRIC RANK
66.2%
IN LABOR FORCE | AGE > 16
99.7/ 100
METRIC RATING
73rd/ 347
METRIC RANK

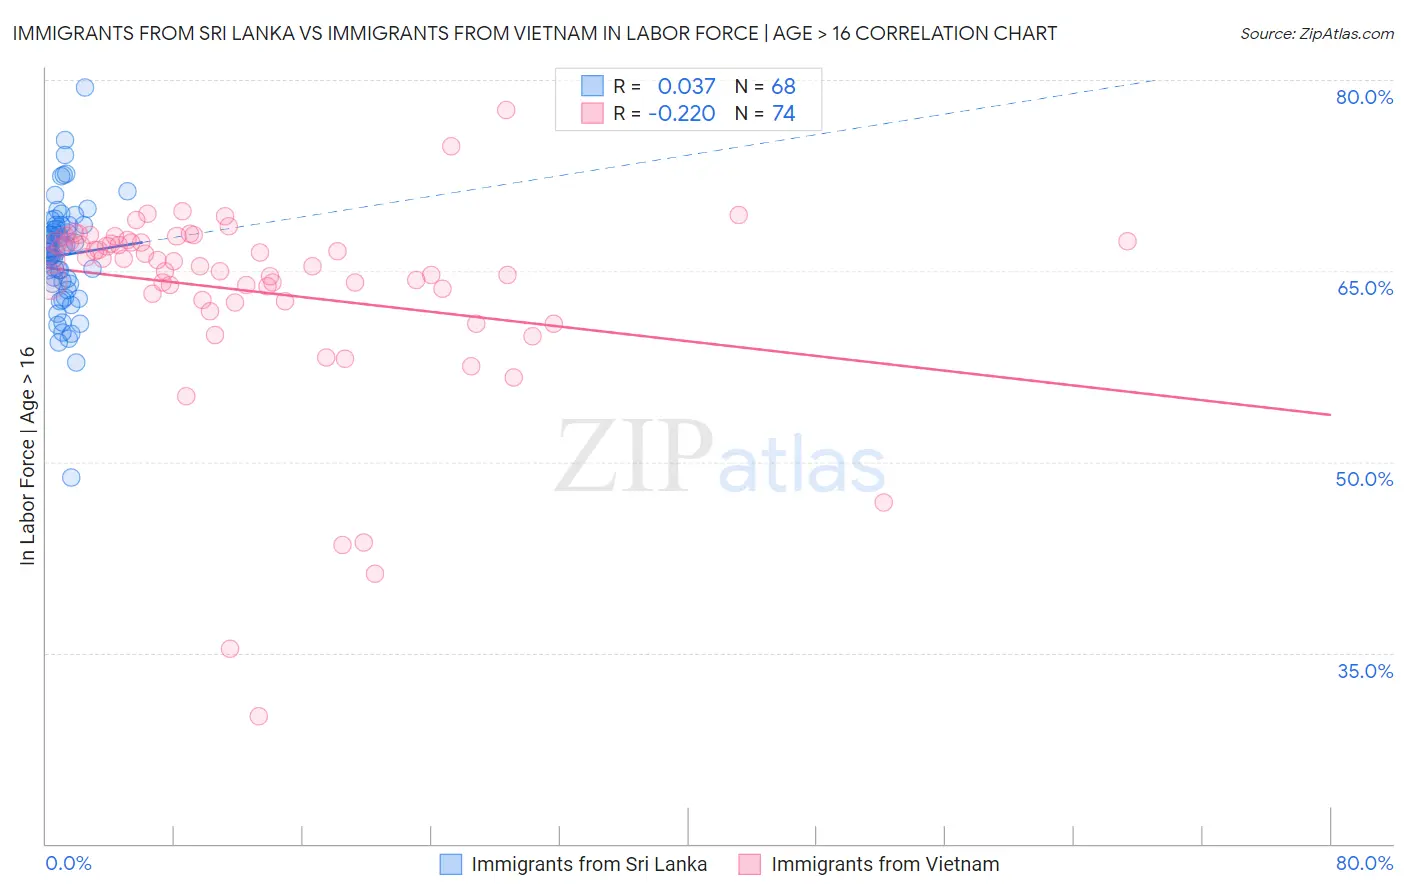
Immigrants from Sri Lanka vs Immigrants from Vietnam In Labor Force | Age > 16 Correlation Chart

The statistical analysis conducted on geographies consisting of 149,698,830 people shows no correlation between the proportion of Immigrants from Sri Lanka and labor force participation rate among population ages 16 and over in the United States with a correlation coefficient (R) of 0.037 and weighted average of 66.5%. Similarly, the statistical analysis conducted on geographies consisting of 404,839,190 people shows a weak negative correlation between the proportion of Immigrants from Vietnam and labor force participation rate among population ages 16 and over in the United States with a correlation coefficient (R) of -0.220 and weighted average of 66.2%, a difference of 0.46%.
Immigrants from Sri Lanka vs Immigrants from Vietnam In Labor Force | Age > 16

In Labor Force | Age > 16 Correlation Summary

MeasurementImmigrants from Sri LankaImmigrants from Vietnam
Minimum48.8%30.0%
Maximum79.4%77.6%
Range30.6%47.6%
Mean66.2%63.4%
Median66.5%65.8%
Interquartile 25% (IQ1)64.0%62.7%
Interquartile 75% (IQ3)68.6%67.3%
Interquartile Range (IQR)4.6%4.6%
Standard Deviation (Sample)4.5%8.0%
Standard Deviation (Population)4.4%7.9%

Demographics Similar to Immigrants from Sri Lanka and Immigrants from Vietnam by In Labor Force | Age > 16

In terms of in labor force | age > 16, the demographic groups most similar to Immigrants from Sri Lanka are Immigrants from Bosnia and Herzegovina (66.5%, a difference of 0.030%), Immigrants from Venezuela (66.4%, a difference of 0.080%), Immigrants from Senegal (66.4%, a difference of 0.11%), Bulgarian (66.4%, a difference of 0.12%), and Immigrants from Saudi Arabia (66.3%, a difference of 0.22%). Similarly, the demographic groups most similar to Immigrants from Vietnam are Burmese (66.2%, a difference of 0.010%), Taiwanese (66.2%, a difference of 0.010%), Asian (66.2%, a difference of 0.030%), Immigrants from Egypt (66.2%, a difference of 0.040%), and Subsaharan African (66.2%, a difference of 0.040%).
DemographicsRating | RankIn Labor Force | Age > 16
Immigrants | Sri Lanka
99.9
/100
|
#53
Exceptional
66.5%
Immigrants | Bosnia and Herzegovina
99.9
/100
|
#54
Exceptional
66.5%
Immigrants | Venezuela
99.9
/100
|
#55
Exceptional
66.4%
Immigrants | Senegal
99.9
/100
|
#56
Exceptional
66.4%
Bulgarians
99.9
/100
|
#57
Exceptional
66.4%
Immigrants | Saudi Arabia
99.9
/100
|
#58
Exceptional
66.3%
Immigrants | Turkey
99.9
/100
|
#59
Exceptional
66.3%
Immigrants | Peru
99.8
/100
|
#60
Exceptional
66.3%
Immigrants | Burma/Myanmar
99.8
/100
|
#61
Exceptional
66.3%
Indonesians
99.8
/100
|
#62
Exceptional
66.3%
Venezuelans
99.8
/100
|
#63
Exceptional
66.3%
Peruvians
99.8
/100
|
#64
Exceptional
66.3%
Sri Lankans
99.8
/100
|
#65
Exceptional
66.3%
Jordanians
99.8
/100
|
#66
Exceptional
66.3%
Egyptians
99.8
/100
|
#67
Exceptional
66.2%
Immigrants | Egypt
99.7
/100
|
#68
Exceptional
66.2%
Sub-Saharan Africans
99.7
/100
|
#69
Exceptional
66.2%
Asians
99.7
/100
|
#70
Exceptional
66.2%
Burmese
99.7
/100
|
#71
Exceptional
66.2%
Taiwanese
99.7
/100
|
#72
Exceptional
66.2%
Immigrants | Vietnam
99.7
/100
|
#73
Exceptional
66.2%