Immigrants from Singapore vs Immigrants from Scotland In Labor Force | Age 20-64

COMPARE

Immigrants from Singapore
Race
Ancestry
AfghanAfricanAlaska NativeAlaskan AthabascanAlbanianAleutAlsatianAmericanApacheArabArapahoArgentineanArmenianAssyrian/Chaldean/SyriacAustralianAustrianBahamianBangladeshiBarbadianBasqueBelgianBelizeanBermudanBhutaneseBlackfeetBolivianBrazilianBritishBritish West IndianBulgarianBurmeseCajunCambodianCanadianCape VerdeanCarpatho RusynCelticCentral AmericanCentral American IndianCherokeeCheyenneChickasawChileanChineseChippewaChoctawColombianColvilleComancheCosta RicanCreeCreekCroatianCrowCubanCypriotCzechCzechoslovakianDanishDelawareDominicanDutchDutch West IndianEastern EuropeanEcuadorianEgyptianEnglishEstonianEthiopianEuropeanFijianFilipinoFinnishFrenchFrench American IndianFrench CanadianGermanGerman RussianGhanaianGreekGuamanian/ChamorroGuatemalanGuyaneseHaitianHmongHonduranHopiHoumaHungarianIcelanderIndian (Asian)IndonesianInupiatIranianIraqiIrishIroquoisIsraeliItalianJamaicanJapaneseJordanianKenyanKiowaKoreanLaotianLatvianLebaneseLiberianLithuanianLumbeeLuxembourgerMacedonianMalaysianMalteseMarshalleseMenomineeMexicanMexican American IndianMongolianMoroccanNative HawaiianNavajoNepaleseNew ZealanderNicaraguanNigerianNorthern EuropeanNorwegianOkinawanOsageOttawaPaiutePakistaniPalestinianPanamanianParaguayanPennsylvania GermanPeruvianPimaPolishPortuguesePotawatomiPuebloPuerto RicanPuget Sound SalishRomanianRussianSalvadoranSamoanScandinavianScotch-IrishScottishSeminoleSenegaleseSerbianShoshoneSierra LeoneanSiouxSlavicSlovakSloveneSomaliSouth AfricanSouth AmericanSouth American IndianSoviet UnionSpaniardSpanishSpanish AmericanSpanish American IndianSri LankanSubsaharan AfricanSudaneseSwedishSwissSyrianTaiwaneseThaiTlingit-HaidaTohono O'OdhamTonganTrinidadian and TobagonianTsimshianTurkishU.S. Virgin IslanderUgandanUkrainianUruguayanUteVenezuelanVietnameseWelshWest IndianYakamaYaquiYugoslavianYumanYup'ikZimbabwean
Immigration
NonimmigrantsImmigrantsAfghanistanAfricaAlbaniaArgentinaArmeniaAsiaAustraliaAustriaBahamasBangladeshBarbadosBelarusBelgiumBelizeBoliviaBosnia and HerzegovinaBrazilBulgariaBurma/MyanmarCabo VerdeCambodiaCameroonCanadaCaribbeanCentral AmericaChileChinaColombiaCongoCosta RicaCroatiaCubaCzechoslovakiaDenmarkDominicaDominican RepublicEastern AfricaEastern AsiaEastern EuropeEcuadorEgyptEl SalvadorEnglandEritreaEthiopiaEuropeFijiFranceGermanyGhanaGreeceGrenadaGuatemalaGuyanaHaitiHondurasHong KongHungaryIndiaIndonesiaIranIraqIrelandIsraelItalyJamaicaJapanJordanKazakhstanKenyaKoreaKuwaitLaosLatin AmericaLatviaLebanonLiberiaLithuaniaMalaysiaMexicoMicronesiaMiddle AfricaMoldovaMoroccoNepalNetherlandsNicaraguaNigeriaNorth AmericaNorth MacedoniaNorthern AfricaNorthern EuropeNorwayOceaniaPakistanPanamaPeruPhilippinesPolandPortugalRomaniaRussiaSaudi ArabiaSenegalSerbiaSierra LeoneSingaporeSomaliaSouth AfricaSouth AmericaSouth Central AsiaSouth Eastern AsiaSouthern EuropeSpainSri LankaSt. Vincent and the GrenadinesSudanSwedenSwitzerlandSyriaTaiwanThailandTrinidad and TobagoTurkeyUgandaUkraineUruguayUzbekistanVenezuelaVietnamWest IndiesWestern AfricaWestern AsiaWestern EuropeYemenZaireZimbabweAzores
Immigrants from Scotland
Race
Ancestry
AfghanAfricanAlaska NativeAlaskan AthabascanAlbanianAleutAlsatianAmericanApacheArabArapahoArgentineanArmenianAssyrian/Chaldean/SyriacAustralianAustrianBahamianBangladeshiBarbadianBasqueBelgianBelizeanBermudanBhutaneseBlackfeetBolivianBrazilianBritishBritish West IndianBulgarianBurmeseCajunCambodianCanadianCape VerdeanCarpatho RusynCelticCentral AmericanCentral American IndianCherokeeCheyenneChickasawChileanChineseChippewaChoctawColombianColvilleComancheCosta RicanCreeCreekCroatianCrowCubanCypriotCzechCzechoslovakianDanishDelawareDominicanDutchDutch West IndianEastern EuropeanEcuadorianEgyptianEnglishEstonianEthiopianEuropeanFijianFilipinoFinnishFrenchFrench American IndianFrench CanadianGermanGerman RussianGhanaianGreekGuamanian/ChamorroGuatemalanGuyaneseHaitianHmongHonduranHopiHoumaHungarianIcelanderIndian (Asian)IndonesianInupiatIranianIraqiIrishIroquoisIsraeliItalianJamaicanJapaneseJordanianKenyanKiowaKoreanLaotianLatvianLebaneseLiberianLithuanianLumbeeLuxembourgerMacedonianMalaysianMalteseMarshalleseMenomineeMexicanMexican American IndianMongolianMoroccanNative HawaiianNavajoNepaleseNew ZealanderNicaraguanNigerianNorthern EuropeanNorwegianOkinawanOsageOttawaPaiutePakistaniPalestinianPanamanianParaguayanPennsylvania GermanPeruvianPimaPolishPortuguesePotawatomiPuebloPuerto RicanPuget Sound SalishRomanianRussianSalvadoranSamoanScandinavianScotch-IrishScottishSeminoleSenegaleseSerbianShoshoneSierra LeoneanSiouxSlavicSlovakSloveneSomaliSouth AfricanSouth AmericanSouth American IndianSoviet UnionSpaniardSpanishSpanish AmericanSpanish American IndianSri LankanSubsaharan AfricanSudaneseSwedishSwissSyrianTaiwaneseThaiTlingit-HaidaTohono O'OdhamTonganTrinidadian and TobagonianTsimshianTurkishU.S. Virgin IslanderUgandanUkrainianUruguayanUteVenezuelanVietnameseWelshWest IndianYakamaYaquiYugoslavianYumanYup'ikZimbabwean
Immigration
NonimmigrantsImmigrantsAfghanistanAfricaAlbaniaArgentinaArmeniaAsiaAustraliaAustriaBahamasBangladeshBarbadosBelarusBelgiumBelizeBoliviaBosnia and HerzegovinaBrazilBulgariaBurma/MyanmarCabo VerdeCambodiaCameroonCanadaCaribbeanCentral AmericaChileChinaColombiaCongoCosta RicaCroatiaCubaCzechoslovakiaDenmarkDominicaDominican RepublicEastern AfricaEastern AsiaEastern EuropeEcuadorEgyptEl SalvadorEnglandEritreaEthiopiaEuropeFijiFranceGermanyGhanaGreeceGrenadaGuatemalaGuyanaHaitiHondurasHong KongHungaryIndiaIndonesiaIranIraqIrelandIsraelItalyJamaicaJapanJordanKazakhstanKenyaKoreaKuwaitLaosLatin AmericaLatviaLebanonLiberiaLithuaniaMalaysiaMexicoMicronesiaMiddle AfricaMoldovaMoroccoNepalNetherlandsNicaraguaNigeriaNorth AmericaNorth MacedoniaNorthern AfricaNorthern EuropeNorwayOceaniaPakistanPanamaPeruPhilippinesPolandPortugalRomaniaRussiaSaudi ArabiaScotlandSenegalSerbiaSierra LeoneSomaliaSouth AfricaSouth AmericaSouth Central AsiaSouth Eastern AsiaSouthern EuropeSpainSri LankaSt. Vincent and the GrenadinesSudanSwedenSwitzerlandSyriaTaiwanThailandTrinidad and TobagoTurkeyUgandaUkraineUruguayUzbekistanVenezuelaVietnamWest IndiesWestern AfricaWestern AsiaWestern EuropeYemenZaireZimbabweAzores
In Labor Force | Age 20-64
Income
Poverty
Unemployment
Labor Participation
Family Structure
Vehicle Availability
Education Level
Disability

In Labor Force | Age 20-64 Comparison

Immigrants from Singapore

Immigrants from Scotland

Excellent
Average
79.9%
IN LABOR FORCE | AGE 20-64
86.7/ 100
METRIC RATING
136th/ 347
METRIC RANK
79.6%
IN LABOR FORCE | AGE 20-64
52.4/ 100
METRIC RATING
173rd/ 347
METRIC RANK

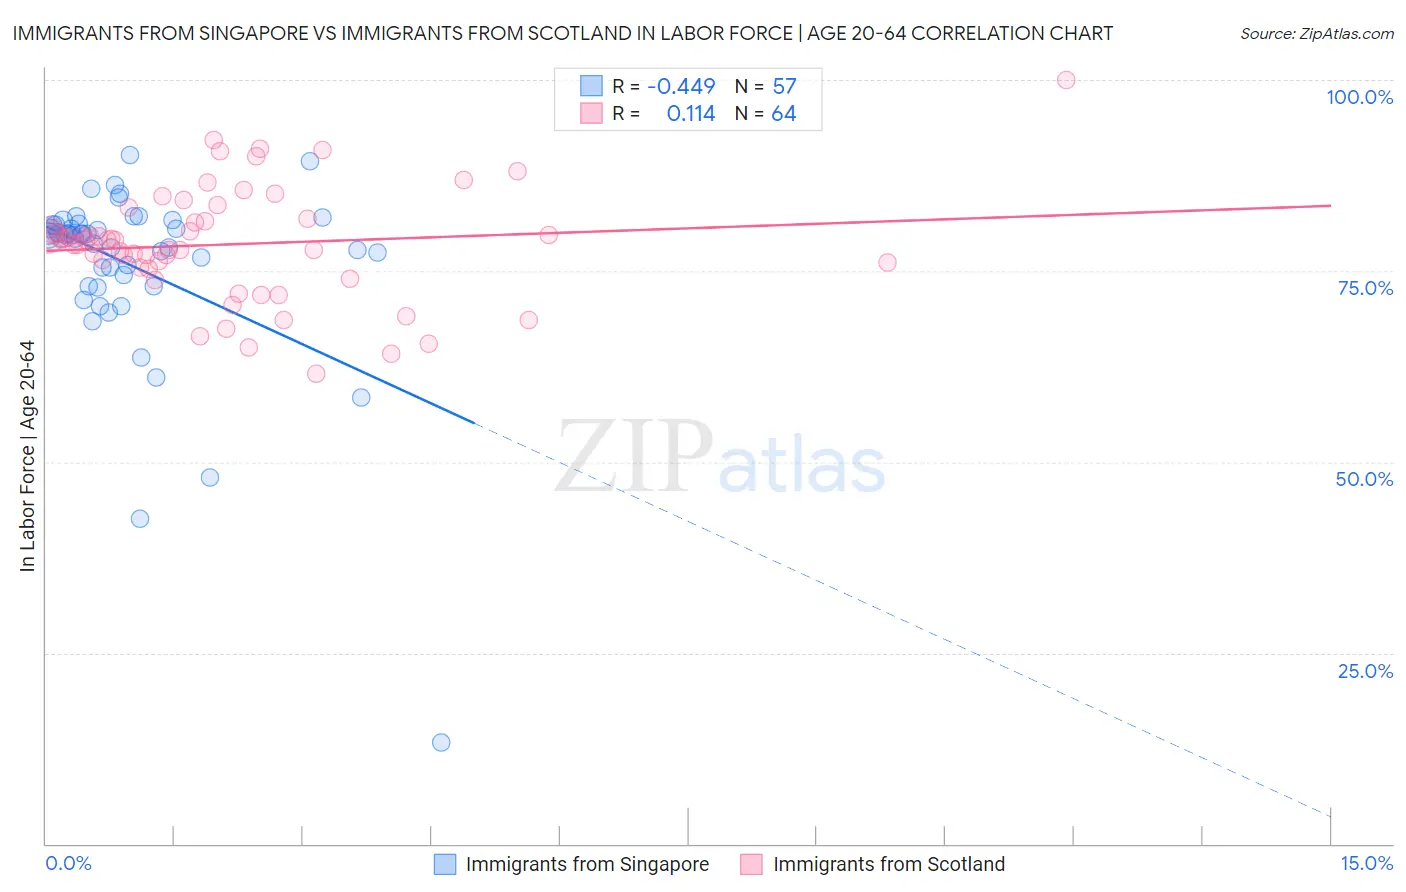
Immigrants from Singapore vs Immigrants from Scotland In Labor Force | Age 20-64 Correlation Chart

The statistical analysis conducted on geographies consisting of 137,521,700 people shows a moderate negative correlation between the proportion of Immigrants from Singapore and labor force participation rate among population between the ages 20 and 64 in the United States with a correlation coefficient (R) of -0.449 and weighted average of 79.9%. Similarly, the statistical analysis conducted on geographies consisting of 196,399,264 people shows a poor positive correlation between the proportion of Immigrants from Scotland and labor force participation rate among population between the ages 20 and 64 in the United States with a correlation coefficient (R) of 0.114 and weighted average of 79.6%, a difference of 0.36%.
Immigrants from Singapore vs Immigrants from Scotland In Labor Force | Age 20-64

In Labor Force | Age 20-64 Correlation Summary

MeasurementImmigrants from SingaporeImmigrants from Scotland
Minimum13.2%61.5%
Maximum90.1%100.0%
Range76.9%38.5%
Mean75.7%78.5%
Median79.7%79.0%
Interquartile 25% (IQ1)73.7%75.4%
Interquartile 75% (IQ3)81.0%81.7%
Interquartile Range (IQR)7.3%6.3%
Standard Deviation (Sample)12.0%7.4%
Standard Deviation (Population)11.9%7.3%

Similar Demographics by In Labor Force | Age 20-64

Demographics Similar to Immigrants from Singapore by In Labor Force | Age 20-64

In terms of in labor force | age 20-64, the demographic groups most similar to Immigrants from Singapore are Ukrainian (79.9%, a difference of 0.0%), Immigrants from Ukraine (79.9%, a difference of 0.0%), Belgian (79.9%, a difference of 0.010%), Immigrants from Nigeria (79.9%, a difference of 0.010%), and Indian (Asian) (79.9%, a difference of 0.020%).
DemographicsRating | RankIn Labor Force | Age 20-64
Italians
88.9
/100
|
#129
Excellent
79.9%
Immigrants | Zaire
88.6
/100
|
#130
Excellent
79.9%
Immigrants | Iran
88.3
/100
|
#131
Excellent
79.9%
Indians (Asian)
87.7
/100
|
#132
Excellent
79.9%
South American Indians
87.6
/100
|
#133
Excellent
79.9%
Belgians
87.4
/100
|
#134
Excellent
79.9%
Ukrainians
86.8
/100
|
#135
Excellent
79.9%
Immigrants | Singapore
86.7
/100
|
#136
Excellent
79.9%
Immigrants | Ukraine
86.5
/100
|
#137
Excellent
79.9%
Immigrants | Nigeria
86.4
/100
|
#138
Excellent
79.9%
Immigrants | Spain
83.9
/100
|
#139
Excellent
79.8%
Immigrants | South Eastern Asia
80.4
/100
|
#140
Excellent
79.8%
Immigrants | Israel
80.0
/100
|
#141
Good
79.8%
Slovaks
79.9
/100
|
#142
Good
79.8%
Immigrants | Sweden
79.7
/100
|
#143
Good
79.8%

Demographics Similar to Immigrants from Scotland by In Labor Force | Age 20-64

In terms of in labor force | age 20-64, the demographic groups most similar to Immigrants from Scotland are Slavic (79.6%, a difference of 0.010%), Immigrants from Switzerland (79.6%, a difference of 0.010%), Immigrants from Belgium (79.6%, a difference of 0.010%), Syrian (79.6%, a difference of 0.020%), and Laotian (79.6%, a difference of 0.050%).
DemographicsRating | RankIn Labor Force | Age 20-64
Okinawans
62.7
/100
|
#166
Good
79.6%
Immigrants | Iraq
62.0
/100
|
#167
Good
79.6%
Immigrants | Indonesia
61.8
/100
|
#168
Good
79.6%
Laotians
58.4
/100
|
#169
Average
79.6%
Slavs
54.0
/100
|
#170
Average
79.6%
Immigrants | Switzerland
53.3
/100
|
#171
Average
79.6%
Immigrants | Belgium
53.1
/100
|
#172
Average
79.6%
Immigrants | Scotland
52.4
/100
|
#173
Average
79.6%
Syrians
50.0
/100
|
#174
Average
79.6%
Cubans
46.1
/100
|
#175
Average
79.5%
Australians
46.0
/100
|
#176
Average
79.5%
Immigrants | Netherlands
45.2
/100
|
#177
Average
79.5%
Czechoslovakians
44.3
/100
|
#178
Average
79.5%
Armenians
41.4
/100
|
#179
Average
79.5%
Salvadorans
41.0
/100
|
#180
Average
79.5%