Immigrants from Philippines vs Immigrants from Norway In Labor Force | Age 45-54

COMPARE

Immigrants from Philippines
Race
Ancestry
AfghanAfricanAlaska NativeAlaskan AthabascanAlbanianAleutAlsatianAmericanApacheArabArapahoArgentineanArmenianAssyrian/Chaldean/SyriacAustralianAustrianBahamianBangladeshiBarbadianBasqueBelgianBelizeanBermudanBhutaneseBlackfeetBolivianBrazilianBritishBritish West IndianBulgarianBurmeseCajunCambodianCanadianCape VerdeanCarpatho RusynCelticCentral AmericanCentral American IndianCherokeeCheyenneChickasawChileanChineseChippewaChoctawColombianColvilleComancheCosta RicanCreeCreekCroatianCrowCubanCypriotCzechCzechoslovakianDanishDelawareDominicanDutchDutch West IndianEastern EuropeanEcuadorianEgyptianEnglishEstonianEthiopianEuropeanFijianFilipinoFinnishFrenchFrench American IndianFrench CanadianGermanGerman RussianGhanaianGreekGuamanian/ChamorroGuatemalanGuyaneseHaitianHmongHonduranHopiHoumaHungarianIcelanderIndian (Asian)IndonesianInupiatIranianIraqiIrishIroquoisIsraeliItalianJamaicanJapaneseJordanianKenyanKiowaKoreanLaotianLatvianLebaneseLiberianLithuanianLumbeeLuxembourgerMacedonianMalaysianMalteseMarshalleseMenomineeMexicanMexican American IndianMongolianMoroccanNative HawaiianNavajoNepaleseNew ZealanderNicaraguanNigerianNorthern EuropeanNorwegianOkinawanOsageOttawaPaiutePakistaniPalestinianPanamanianParaguayanPennsylvania GermanPeruvianPimaPolishPortuguesePotawatomiPuebloPuerto RicanPuget Sound SalishRomanianRussianSalvadoranSamoanScandinavianScotch-IrishScottishSeminoleSenegaleseSerbianShoshoneSierra LeoneanSiouxSlavicSlovakSloveneSomaliSouth AfricanSouth AmericanSouth American IndianSoviet UnionSpaniardSpanishSpanish AmericanSpanish American IndianSri LankanSubsaharan AfricanSudaneseSwedishSwissSyrianTaiwaneseThaiTlingit-HaidaTohono O'OdhamTonganTrinidadian and TobagonianTsimshianTurkishU.S. Virgin IslanderUgandanUkrainianUruguayanUteVenezuelanVietnameseWelshWest IndianYakamaYaquiYugoslavianYumanYup'ikZimbabwean
Immigration
NonimmigrantsImmigrantsAfghanistanAfricaAlbaniaArgentinaArmeniaAsiaAustraliaAustriaBahamasBangladeshBarbadosBelarusBelgiumBelizeBoliviaBosnia and HerzegovinaBrazilBulgariaBurma/MyanmarCabo VerdeCambodiaCameroonCanadaCaribbeanCentral AmericaChileChinaColombiaCongoCosta RicaCroatiaCubaCzechoslovakiaDenmarkDominicaDominican RepublicEastern AfricaEastern AsiaEastern EuropeEcuadorEgyptEl SalvadorEnglandEritreaEthiopiaEuropeFijiFranceGermanyGhanaGreeceGrenadaGuatemalaGuyanaHaitiHondurasHong KongHungaryIndiaIndonesiaIranIraqIrelandIsraelItalyJamaicaJapanJordanKazakhstanKenyaKoreaKuwaitLaosLatin AmericaLatviaLebanonLiberiaLithuaniaMalaysiaMexicoMicronesiaMiddle AfricaMoldovaMoroccoNepalNetherlandsNicaraguaNigeriaNorth AmericaNorth MacedoniaNorthern AfricaNorthern EuropeOceaniaPakistanPanamaPeruPhilippinesPolandPortugalRomaniaRussiaSaudi ArabiaScotlandSenegalSerbiaSierra LeoneSingaporeSomaliaSouth AfricaSouth AmericaSouth Central AsiaSouth Eastern AsiaSouthern EuropeSpainSri LankaSt. Vincent and the GrenadinesSudanSwedenSwitzerlandSyriaTaiwanThailandTrinidad and TobagoTurkeyUgandaUkraineUruguayUzbekistanVenezuelaVietnamWest IndiesWestern AfricaWestern AsiaWestern EuropeYemenZaireZimbabweAzores
Immigrants from Norway
Race
Ancestry
AfghanAfricanAlaska NativeAlaskan AthabascanAlbanianAleutAlsatianAmericanApacheArabArapahoArgentineanArmenianAssyrian/Chaldean/SyriacAustralianAustrianBahamianBangladeshiBarbadianBasqueBelgianBelizeanBermudanBhutaneseBlackfeetBolivianBrazilianBritishBritish West IndianBulgarianBurmeseCajunCambodianCanadianCape VerdeanCarpatho RusynCelticCentral AmericanCentral American IndianCherokeeCheyenneChickasawChileanChineseChippewaChoctawColombianColvilleComancheCosta RicanCreeCreekCroatianCrowCubanCypriotCzechCzechoslovakianDanishDelawareDominicanDutchDutch West IndianEastern EuropeanEcuadorianEgyptianEnglishEstonianEthiopianEuropeanFijianFilipinoFinnishFrenchFrench American IndianFrench CanadianGermanGerman RussianGhanaianGreekGuamanian/ChamorroGuatemalanGuyaneseHaitianHmongHonduranHopiHoumaHungarianIcelanderIndian (Asian)IndonesianInupiatIranianIraqiIrishIroquoisIsraeliItalianJamaicanJapaneseJordanianKenyanKiowaKoreanLaotianLatvianLebaneseLiberianLithuanianLumbeeLuxembourgerMacedonianMalaysianMalteseMarshalleseMenomineeMexicanMexican American IndianMongolianMoroccanNative HawaiianNavajoNepaleseNew ZealanderNicaraguanNigerianNorthern EuropeanNorwegianOkinawanOsageOttawaPaiutePakistaniPalestinianPanamanianParaguayanPennsylvania GermanPeruvianPimaPolishPortuguesePotawatomiPuebloPuerto RicanPuget Sound SalishRomanianRussianSalvadoranSamoanScandinavianScotch-IrishScottishSeminoleSenegaleseSerbianShoshoneSierra LeoneanSiouxSlavicSlovakSloveneSomaliSouth AfricanSouth AmericanSouth American IndianSoviet UnionSpaniardSpanishSpanish AmericanSpanish American IndianSri LankanSubsaharan AfricanSudaneseSwedishSwissSyrianTaiwaneseThaiTlingit-HaidaTohono O'OdhamTonganTrinidadian and TobagonianTsimshianTurkishU.S. Virgin IslanderUgandanUkrainianUruguayanUteVenezuelanVietnameseWelshWest IndianYakamaYaquiYugoslavianYumanYup'ikZimbabwean
Immigration
NonimmigrantsImmigrantsAfghanistanAfricaAlbaniaArgentinaArmeniaAsiaAustraliaAustriaBahamasBangladeshBarbadosBelarusBelgiumBelizeBoliviaBosnia and HerzegovinaBrazilBulgariaBurma/MyanmarCabo VerdeCambodiaCameroonCanadaCaribbeanCentral AmericaChileChinaColombiaCongoCosta RicaCroatiaCubaCzechoslovakiaDenmarkDominicaDominican RepublicEastern AfricaEastern AsiaEastern EuropeEcuadorEgyptEl SalvadorEnglandEritreaEthiopiaEuropeFijiFranceGermanyGhanaGreeceGrenadaGuatemalaGuyanaHaitiHondurasHong KongHungaryIndiaIndonesiaIranIraqIrelandIsraelItalyJamaicaJapanJordanKazakhstanKenyaKoreaKuwaitLaosLatin AmericaLatviaLebanonLiberiaLithuaniaMalaysiaMexicoMicronesiaMiddle AfricaMoldovaMoroccoNepalNetherlandsNicaraguaNigeriaNorth AmericaNorth MacedoniaNorthern AfricaNorthern EuropeNorwayOceaniaPakistanPanamaPeruPolandPortugalRomaniaRussiaSaudi ArabiaScotlandSenegalSerbiaSierra LeoneSingaporeSomaliaSouth AfricaSouth AmericaSouth Central AsiaSouth Eastern AsiaSouthern EuropeSpainSri LankaSt. Vincent and the GrenadinesSudanSwedenSwitzerlandSyriaTaiwanThailandTrinidad and TobagoTurkeyUgandaUkraineUruguayUzbekistanVenezuelaVietnamWest IndiesWestern AfricaWestern AsiaWestern EuropeYemenZaireZimbabweAzores
In Labor Force | Age 45-54
Income
Poverty
Unemployment
Labor Participation
Family Structure
Vehicle Availability
Education Level
Disability

In Labor Force | Age 45-54 Comparison

Immigrants from Philippines

Immigrants from Norway

Good
Fair
82.9%
IN LABOR FORCE | AGE 45-54
69.0/ 100
METRIC RATING
155th/ 347
METRIC RANK
82.5%
IN LABOR FORCE | AGE 45-54
20.7/ 100
METRIC RATING
194th/ 347
METRIC RANK

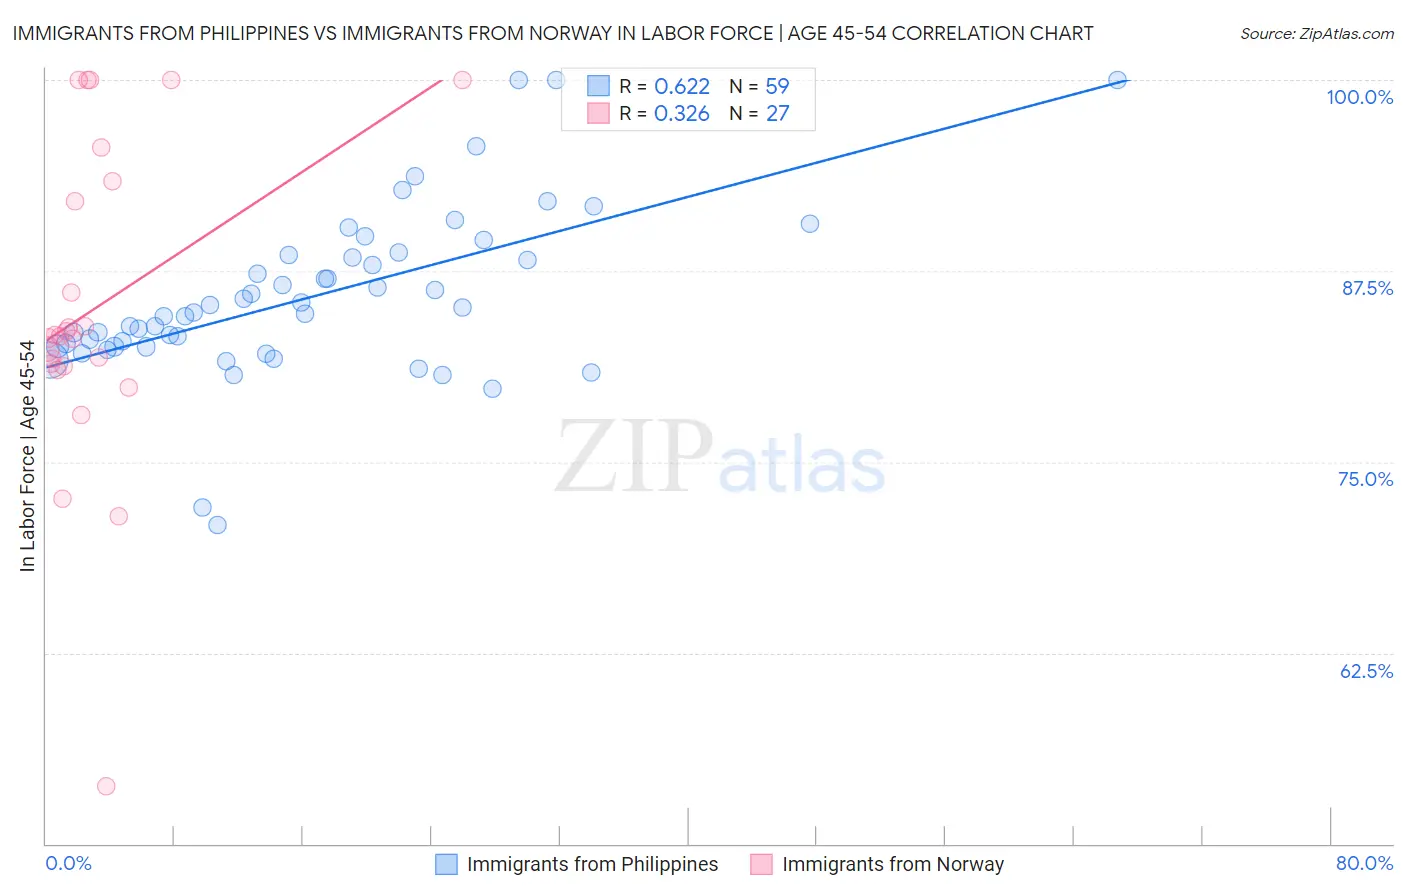
Immigrants from Philippines vs Immigrants from Norway In Labor Force | Age 45-54 Correlation Chart

The statistical analysis conducted on geographies consisting of 471,007,870 people shows a significant positive correlation between the proportion of Immigrants from Philippines and labor force participation rate among population between the ages 45 and 54 in the United States with a correlation coefficient (R) of 0.622 and weighted average of 82.9%. Similarly, the statistical analysis conducted on geographies consisting of 116,685,095 people shows a mild positive correlation between the proportion of Immigrants from Norway and labor force participation rate among population between the ages 45 and 54 in the United States with a correlation coefficient (R) of 0.326 and weighted average of 82.5%, a difference of 0.47%.
Immigrants from Philippines vs Immigrants from Norway In Labor Force | Age 45-54

In Labor Force | Age 45-54 Correlation Summary

MeasurementImmigrants from PhilippinesImmigrants from Norway
Minimum70.9%53.8%
Maximum100.0%100.0%
Range29.1%46.2%
Mean85.8%85.1%
Median84.7%83.2%
Interquartile 25% (IQ1)82.5%81.3%
Interquartile 75% (IQ3)88.6%93.4%
Interquartile Range (IQR)6.0%12.1%
Standard Deviation (Sample)5.5%10.4%
Standard Deviation (Population)5.5%10.2%

Similar Demographics by In Labor Force | Age 45-54

Demographics Similar to Immigrants from Philippines by In Labor Force | Age 45-54

In terms of in labor force | age 45-54, the demographic groups most similar to Immigrants from Philippines are Immigrants from Saudi Arabia (82.9%, a difference of 0.0%), Immigrants from Ghana (82.9%, a difference of 0.010%), Immigrants from Australia (82.9%, a difference of 0.010%), Immigrants from Southern Europe (82.9%, a difference of 0.010%), and Immigrants from Indonesia (82.9%, a difference of 0.020%).
DemographicsRating | RankIn Labor Force | Age 45-54
Immigrants | Nigeria
74.1
/100
|
#148
Good
83.0%
Immigrants | Sweden
73.3
/100
|
#149
Good
82.9%
Immigrants | Netherlands
72.6
/100
|
#150
Good
82.9%
Koreans
71.9
/100
|
#151
Good
82.9%
Slavs
71.5
/100
|
#152
Good
82.9%
Immigrants | Indonesia
70.6
/100
|
#153
Good
82.9%
Immigrants | Ghana
70.3
/100
|
#154
Good
82.9%
Immigrants | Philippines
69.0
/100
|
#155
Good
82.9%
Immigrants | Saudi Arabia
68.8
/100
|
#156
Good
82.9%
Immigrants | Australia
68.2
/100
|
#157
Good
82.9%
Immigrants | Southern Europe
67.8
/100
|
#158
Good
82.9%
Immigrants | Austria
64.6
/100
|
#159
Good
82.9%
Laotians
62.8
/100
|
#160
Good
82.9%
South American Indians
62.2
/100
|
#161
Good
82.9%
Haitians
61.8
/100
|
#162
Good
82.8%

Demographics Similar to Immigrants from Norway by In Labor Force | Age 45-54

In terms of in labor force | age 45-54, the demographic groups most similar to Immigrants from Norway are Immigrants from Iraq (82.5%, a difference of 0.0%), Australian (82.5%, a difference of 0.0%), Immigrants from Canada (82.5%, a difference of 0.010%), Armenian (82.5%, a difference of 0.030%), and Immigrants from North America (82.5%, a difference of 0.030%).
DemographicsRating | RankIn Labor Force | Age 45-54
Immigrants | Costa Rica
28.3
/100
|
#187
Fair
82.6%
South Africans
28.0
/100
|
#188
Fair
82.6%
Syrians
26.0
/100
|
#189
Fair
82.6%
British
25.7
/100
|
#190
Fair
82.6%
Armenians
23.2
/100
|
#191
Fair
82.5%
Immigrants | Iraq
20.9
/100
|
#192
Fair
82.5%
Australians
20.8
/100
|
#193
Fair
82.5%
Immigrants | Norway
20.7
/100
|
#194
Fair
82.5%
Immigrants | Canada
20.0
/100
|
#195
Fair
82.5%
Immigrants | North America
18.8
/100
|
#196
Poor
82.5%
Lebanese
18.2
/100
|
#197
Poor
82.5%
Immigrants | Denmark
17.9
/100
|
#198
Poor
82.5%
Moroccans
15.7
/100
|
#199
Poor
82.5%
French Canadians
15.4
/100
|
#200
Poor
82.5%
Canadians
15.1
/100
|
#201
Poor
82.4%