Immigrants from Micronesia vs Immigrants from Ireland In Labor Force | Age 20-64

COMPARE

Immigrants from Micronesia
Race
Ancestry
AfghanAfricanAlaska NativeAlaskan AthabascanAlbanianAleutAlsatianAmericanApacheArabArapahoArgentineanArmenianAssyrian/Chaldean/SyriacAustralianAustrianBahamianBangladeshiBarbadianBasqueBelgianBelizeanBermudanBhutaneseBlackfeetBolivianBrazilianBritishBritish West IndianBulgarianBurmeseCajunCambodianCanadianCape VerdeanCarpatho RusynCelticCentral AmericanCentral American IndianCherokeeCheyenneChickasawChileanChineseChippewaChoctawColombianColvilleComancheCosta RicanCreeCreekCroatianCrowCubanCypriotCzechCzechoslovakianDanishDelawareDominicanDutchDutch West IndianEastern EuropeanEcuadorianEgyptianEnglishEstonianEthiopianEuropeanFijianFilipinoFinnishFrenchFrench American IndianFrench CanadianGermanGerman RussianGhanaianGreekGuamanian/ChamorroGuatemalanGuyaneseHaitianHmongHonduranHopiHoumaHungarianIcelanderIndian (Asian)IndonesianInupiatIranianIraqiIrishIroquoisIsraeliItalianJamaicanJapaneseJordanianKenyanKiowaKoreanLaotianLatvianLebaneseLiberianLithuanianLumbeeLuxembourgerMacedonianMalaysianMalteseMarshalleseMenomineeMexicanMexican American IndianMongolianMoroccanNative HawaiianNavajoNepaleseNew ZealanderNicaraguanNigerianNorthern EuropeanNorwegianOkinawanOsageOttawaPaiutePakistaniPalestinianPanamanianParaguayanPennsylvania GermanPeruvianPimaPolishPortuguesePotawatomiPuebloPuerto RicanPuget Sound SalishRomanianRussianSalvadoranSamoanScandinavianScotch-IrishScottishSeminoleSenegaleseSerbianShoshoneSierra LeoneanSiouxSlavicSlovakSloveneSomaliSouth AfricanSouth AmericanSouth American IndianSoviet UnionSpaniardSpanishSpanish AmericanSpanish American IndianSri LankanSubsaharan AfricanSudaneseSwedishSwissSyrianTaiwaneseThaiTlingit-HaidaTohono O'OdhamTonganTrinidadian and TobagonianTsimshianTurkishU.S. Virgin IslanderUgandanUkrainianUruguayanUteVenezuelanVietnameseWelshWest IndianYakamaYaquiYugoslavianYumanYup'ikZimbabwean
Immigration
NonimmigrantsImmigrantsAfghanistanAfricaAlbaniaArgentinaArmeniaAsiaAustraliaAustriaBahamasBangladeshBarbadosBelarusBelgiumBelizeBoliviaBosnia and HerzegovinaBrazilBulgariaBurma/MyanmarCabo VerdeCambodiaCameroonCanadaCaribbeanCentral AmericaChileChinaColombiaCongoCosta RicaCroatiaCubaCzechoslovakiaDenmarkDominicaDominican RepublicEastern AfricaEastern AsiaEastern EuropeEcuadorEgyptEl SalvadorEnglandEritreaEthiopiaEuropeFijiFranceGermanyGhanaGreeceGrenadaGuatemalaGuyanaHaitiHondurasHong KongHungaryIndiaIndonesiaIranIraqIsraelItalyJamaicaJapanJordanKazakhstanKenyaKoreaKuwaitLaosLatin AmericaLatviaLebanonLiberiaLithuaniaMalaysiaMexicoMicronesiaMiddle AfricaMoldovaMoroccoNepalNetherlandsNicaraguaNigeriaNorth AmericaNorth MacedoniaNorthern AfricaNorthern EuropeNorwayOceaniaPakistanPanamaPeruPhilippinesPolandPortugalRomaniaRussiaSaudi ArabiaScotlandSenegalSerbiaSierra LeoneSingaporeSomaliaSouth AfricaSouth AmericaSouth Central AsiaSouth Eastern AsiaSouthern EuropeSpainSri LankaSt. Vincent and the GrenadinesSudanSwedenSwitzerlandSyriaTaiwanThailandTrinidad and TobagoTurkeyUgandaUkraineUruguayUzbekistanVenezuelaVietnamWest IndiesWestern AfricaWestern AsiaWestern EuropeYemenZaireZimbabweAzores
Immigrants from Ireland
Race
Ancestry
AfghanAfricanAlaska NativeAlaskan AthabascanAlbanianAleutAlsatianAmericanApacheArabArapahoArgentineanArmenianAssyrian/Chaldean/SyriacAustralianAustrianBahamianBangladeshiBarbadianBasqueBelgianBelizeanBermudanBhutaneseBlackfeetBolivianBrazilianBritishBritish West IndianBulgarianBurmeseCajunCambodianCanadianCape VerdeanCarpatho RusynCelticCentral AmericanCentral American IndianCherokeeCheyenneChickasawChileanChineseChippewaChoctawColombianColvilleComancheCosta RicanCreeCreekCroatianCrowCubanCypriotCzechCzechoslovakianDanishDelawareDominicanDutchDutch West IndianEastern EuropeanEcuadorianEgyptianEnglishEstonianEthiopianEuropeanFijianFilipinoFinnishFrenchFrench American IndianFrench CanadianGermanGerman RussianGhanaianGreekGuamanian/ChamorroGuatemalanGuyaneseHaitianHmongHonduranHopiHoumaHungarianIcelanderIndian (Asian)IndonesianInupiatIranianIraqiIrishIroquoisIsraeliItalianJamaicanJapaneseJordanianKenyanKiowaKoreanLaotianLatvianLebaneseLiberianLithuanianLumbeeLuxembourgerMacedonianMalaysianMalteseMarshalleseMenomineeMexicanMexican American IndianMongolianMoroccanNative HawaiianNavajoNepaleseNew ZealanderNicaraguanNigerianNorthern EuropeanNorwegianOkinawanOsageOttawaPaiutePakistaniPalestinianPanamanianParaguayanPennsylvania GermanPeruvianPimaPolishPortuguesePotawatomiPuebloPuerto RicanPuget Sound SalishRomanianRussianSalvadoranSamoanScandinavianScotch-IrishScottishSeminoleSenegaleseSerbianShoshoneSierra LeoneanSiouxSlavicSlovakSloveneSomaliSouth AfricanSouth AmericanSouth American IndianSoviet UnionSpaniardSpanishSpanish AmericanSpanish American IndianSri LankanSubsaharan AfricanSudaneseSwedishSwissSyrianTaiwaneseThaiTlingit-HaidaTohono O'OdhamTonganTrinidadian and TobagonianTsimshianTurkishU.S. Virgin IslanderUgandanUkrainianUruguayanUteVenezuelanVietnameseWelshWest IndianYakamaYaquiYugoslavianYumanYup'ikZimbabwean
Immigration
NonimmigrantsImmigrantsAfghanistanAfricaAlbaniaArgentinaArmeniaAsiaAustraliaAustriaBahamasBangladeshBarbadosBelarusBelgiumBelizeBoliviaBosnia and HerzegovinaBrazilBulgariaBurma/MyanmarCabo VerdeCambodiaCameroonCanadaCaribbeanCentral AmericaChileChinaColombiaCongoCosta RicaCroatiaCubaCzechoslovakiaDenmarkDominicaDominican RepublicEastern AfricaEastern AsiaEastern EuropeEcuadorEgyptEl SalvadorEnglandEritreaEthiopiaEuropeFijiFranceGermanyGhanaGreeceGrenadaGuatemalaGuyanaHaitiHondurasHong KongHungaryIndiaIndonesiaIranIraqIrelandIsraelItalyJamaicaJapanJordanKazakhstanKenyaKoreaKuwaitLaosLatin AmericaLatviaLebanonLiberiaLithuaniaMalaysiaMexicoMiddle AfricaMoldovaMoroccoNepalNetherlandsNicaraguaNigeriaNorth AmericaNorth MacedoniaNorthern AfricaNorthern EuropeNorwayOceaniaPakistanPanamaPeruPhilippinesPolandPortugalRomaniaRussiaSaudi ArabiaScotlandSenegalSerbiaSierra LeoneSingaporeSomaliaSouth AfricaSouth AmericaSouth Central AsiaSouth Eastern AsiaSouthern EuropeSpainSri LankaSt. Vincent and the GrenadinesSudanSwedenSwitzerlandSyriaTaiwanThailandTrinidad and TobagoTurkeyUgandaUkraineUruguayUzbekistanVenezuelaVietnamWest IndiesWestern AfricaWestern AsiaWestern EuropeYemenZaireZimbabweAzores
In Labor Force | Age 20-64
Income
Poverty
Unemployment
Labor Participation
Family Structure
Vehicle Availability
Education Level
Disability

In Labor Force | Age 20-64 Comparison

Immigrants from Micronesia

Immigrants from Ireland

Tragic
Exceptional
78.9%
IN LABOR FORCE | AGE 20-64
1.9/ 100
METRIC RATING
242nd/ 347
METRIC RANK
80.7%
IN LABOR FORCE | AGE 20-64
99.9/ 100
METRIC RATING
32nd/ 347
METRIC RANK

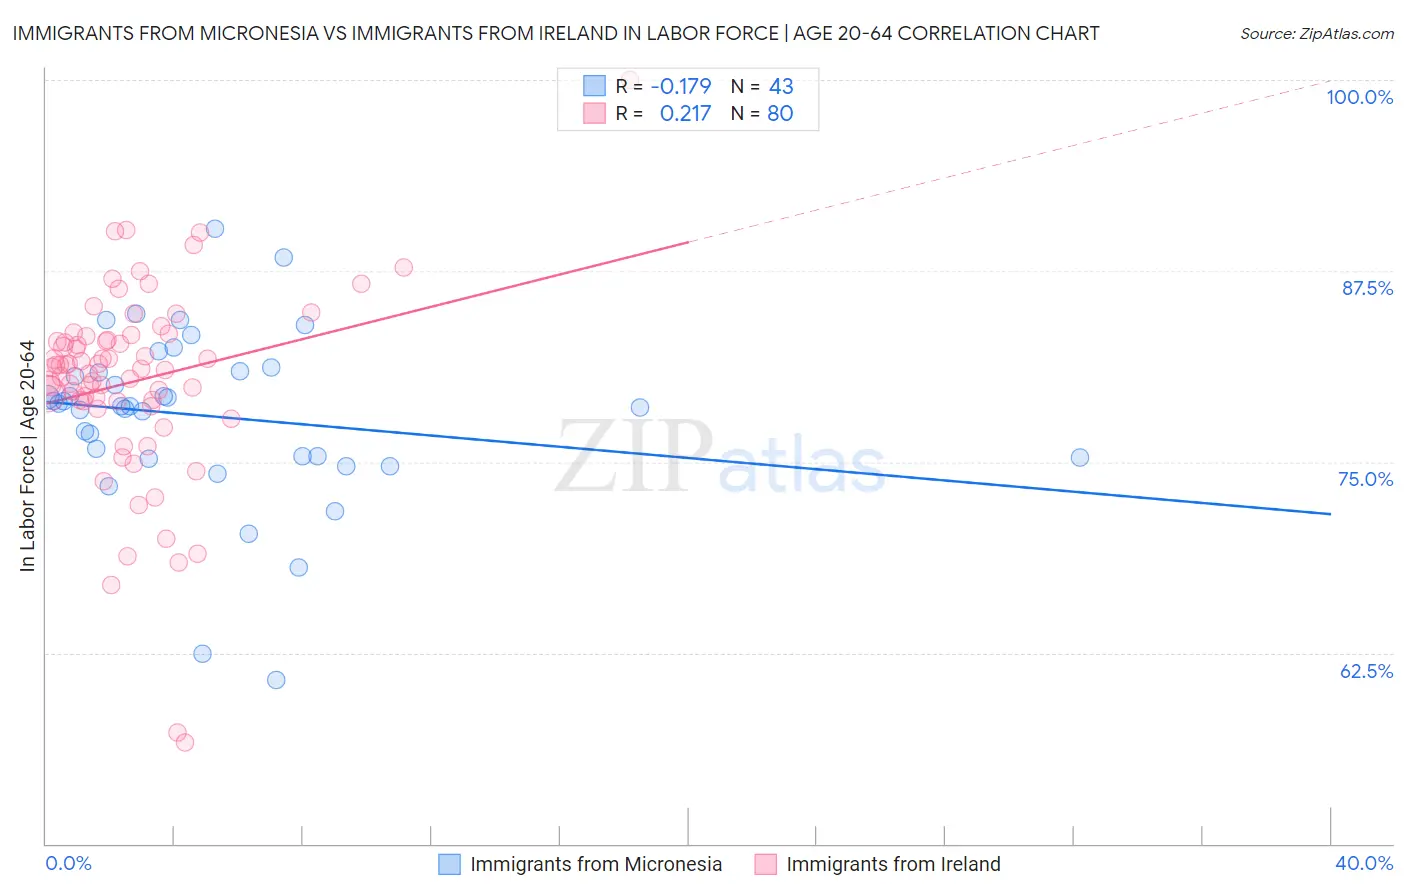
Immigrants from Micronesia vs Immigrants from Ireland In Labor Force | Age 20-64 Correlation Chart

The statistical analysis conducted on geographies consisting of 61,600,666 people shows a poor negative correlation between the proportion of Immigrants from Micronesia and labor force participation rate among population between the ages 20 and 64 in the United States with a correlation coefficient (R) of -0.179 and weighted average of 78.9%. Similarly, the statistical analysis conducted on geographies consisting of 240,784,168 people shows a weak positive correlation between the proportion of Immigrants from Ireland and labor force participation rate among population between the ages 20 and 64 in the United States with a correlation coefficient (R) of 0.217 and weighted average of 80.7%, a difference of 2.2%.
Immigrants from Micronesia vs Immigrants from Ireland In Labor Force | Age 20-64

In Labor Force | Age 20-64 Correlation Summary

MeasurementImmigrants from MicronesiaImmigrants from Ireland
Minimum60.7%56.6%
Maximum90.3%100.0%
Range29.6%43.4%
Mean78.0%80.3%
Median78.7%81.1%
Interquartile 25% (IQ1)75.3%79.0%
Interquartile 75% (IQ3)80.9%83.1%
Interquartile Range (IQR)5.6%4.1%
Standard Deviation (Sample)5.7%6.5%
Standard Deviation (Population)5.6%6.4%

Similar Demographics by In Labor Force | Age 20-64

Demographics Similar to Immigrants from Micronesia by In Labor Force | Age 20-64

In terms of in labor force | age 20-64, the demographic groups most similar to Immigrants from Micronesia are Jamaican (78.9%, a difference of 0.010%), Immigrants from West Indies (78.9%, a difference of 0.020%), Welsh (79.0%, a difference of 0.040%), Trinidadian and Tobagonian (79.0%, a difference of 0.040%), and French (78.9%, a difference of 0.050%).
DemographicsRating | RankIn Labor Force | Age 20-64
Tlingit-Haida
3.2
/100
|
#235
Tragic
79.0%
Samoans
2.9
/100
|
#236
Tragic
79.0%
Immigrants | North America
2.9
/100
|
#237
Tragic
79.0%
Immigrants | Jamaica
2.6
/100
|
#238
Tragic
79.0%
Welsh
2.4
/100
|
#239
Tragic
79.0%
Trinidadians and Tobagonians
2.3
/100
|
#240
Tragic
79.0%
Jamaicans
2.0
/100
|
#241
Tragic
78.9%
Immigrants | Micronesia
1.9
/100
|
#242
Tragic
78.9%
Immigrants | West Indies
1.7
/100
|
#243
Tragic
78.9%
French
1.5
/100
|
#244
Tragic
78.9%
Scottish
1.3
/100
|
#245
Tragic
78.9%
Immigrants | Trinidad and Tobago
1.1
/100
|
#246
Tragic
78.8%
Immigrants | Germany
1.0
/100
|
#247
Tragic
78.8%
Immigrants | Caribbean
1.0
/100
|
#248
Tragic
78.8%
English
0.9
/100
|
#249
Tragic
78.8%

Demographics Similar to Immigrants from Ireland by In Labor Force | Age 20-64

In terms of in labor force | age 20-64, the demographic groups most similar to Immigrants from Ireland are Immigrants from Lithuania (80.7%, a difference of 0.010%), Immigrants from South Central Asia (80.7%, a difference of 0.030%), Immigrants from North Macedonia (80.7%, a difference of 0.030%), Chinese (80.7%, a difference of 0.030%), and Immigrants from Uganda (80.7%, a difference of 0.050%).
DemographicsRating | RankIn Labor Force | Age 20-64
Kenyans
100.0
/100
|
#25
Exceptional
80.8%
Immigrants | Serbia
100.0
/100
|
#26
Exceptional
80.8%
Immigrants | Kenya
99.9
/100
|
#27
Exceptional
80.7%
Immigrants | Uganda
99.9
/100
|
#28
Exceptional
80.7%
Immigrants | South Central Asia
99.9
/100
|
#29
Exceptional
80.7%
Immigrants | North Macedonia
99.9
/100
|
#30
Exceptional
80.7%
Immigrants | Lithuania
99.9
/100
|
#31
Exceptional
80.7%
Immigrants | Ireland
99.9
/100
|
#32
Exceptional
80.7%
Chinese
99.9
/100
|
#33
Exceptional
80.7%
Immigrants | Brazil
99.9
/100
|
#34
Exceptional
80.7%
Immigrants | Poland
99.9
/100
|
#35
Exceptional
80.6%
Paraguayans
99.8
/100
|
#36
Exceptional
80.6%
Immigrants | Moldova
99.8
/100
|
#37
Exceptional
80.6%
Ugandans
99.8
/100
|
#38
Exceptional
80.6%
Brazilians
99.8
/100
|
#39
Exceptional
80.5%