Immigrants from Liberia vs Immigrants from Sierra Leone In Labor Force | Age 35-44
COMPARE
Immigrants from Liberia
Immigrants from Sierra Leone
In Labor Force | Age 35-44
In Labor Force | Age 35-44 Comparison
Immigrants from Liberia
Immigrants from Sierra Leone
85.4%
IN LABOR FORCE | AGE 35-44
99.9/ 100
METRIC RATING
26th/ 347
METRIC RANK
86.1%
IN LABOR FORCE | AGE 35-44
100.0/ 100
METRIC RATING
7th/ 347
METRIC RANK
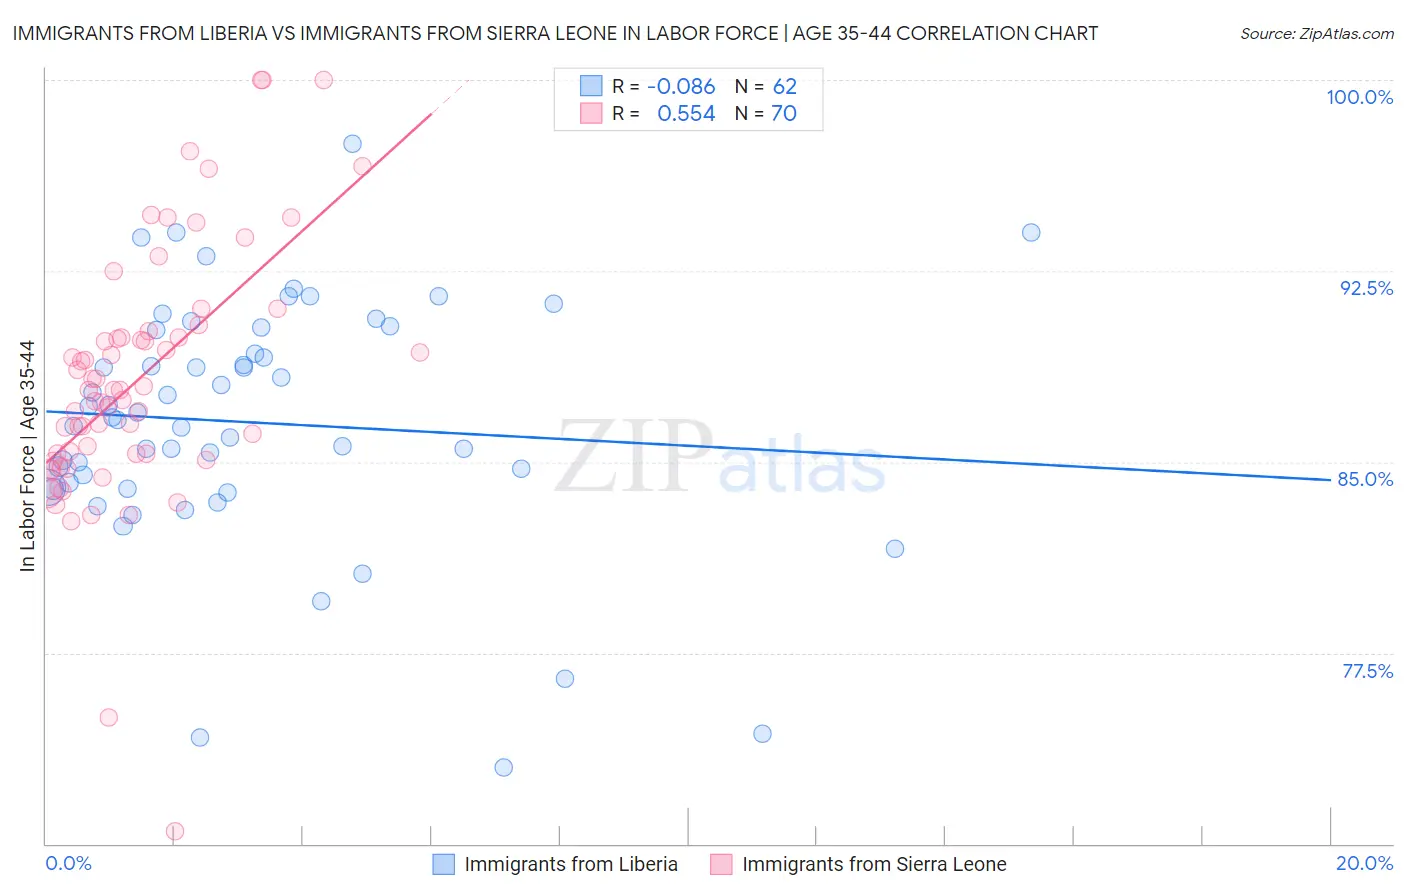
Immigrants from Liberia vs Immigrants from Sierra Leone In Labor Force | Age 35-44 Correlation Chart
The statistical analysis conducted on geographies consisting of 135,260,455 people shows a slight negative correlation between the proportion of Immigrants from Liberia and labor force participation rate among population between the ages 35 and 44 in the United States with a correlation coefficient (R) of -0.086 and weighted average of 85.4%. Similarly, the statistical analysis conducted on geographies consisting of 101,643,562 people shows a substantial positive correlation between the proportion of Immigrants from Sierra Leone and labor force participation rate among population between the ages 35 and 44 in the United States with a correlation coefficient (R) of 0.554 and weighted average of 86.1%, a difference of 0.81%.
In Labor Force | Age 35-44 Correlation Summary
| Measurement | Immigrants from Liberia | Immigrants from Sierra Leone |
| Minimum | 73.0% | 70.5% |
| Maximum | 97.5% | 100.0% |
| Range | 24.5% | 29.5% |
| Mean | 86.5% | 88.2% |
| Median | 86.7% | 87.8% |
| Interquartile 25% (IQ1) | 84.0% | 85.3% |
| Interquartile 75% (IQ3) | 90.2% | 89.9% |
| Interquartile Range (IQR) | 6.2% | 4.6% |
| Standard Deviation (Sample) | 4.8% | 5.0% |
| Standard Deviation (Population) | 4.8% | 5.0% |
Demographics Similar to Immigrants from Liberia and Immigrants from Sierra Leone by In Labor Force | Age 35-44
In terms of in labor force | age 35-44, the demographic groups most similar to Immigrants from Liberia are Paraguayan (85.4%, a difference of 0.0%), Latvian (85.4%, a difference of 0.010%), Immigrants from Eastern Africa (85.4%, a difference of 0.070%), Immigrants from Bosnia and Herzegovina (85.4%, a difference of 0.090%), and Bulgarian (85.5%, a difference of 0.13%). Similarly, the demographic groups most similar to Immigrants from Sierra Leone are Bolivian (86.1%, a difference of 0.040%), Immigrants from Ethiopia (85.9%, a difference of 0.17%), Ethiopian (85.9%, a difference of 0.18%), Cape Verdean (85.8%, a difference of 0.31%), and Immigrants from Cameroon (85.8%, a difference of 0.33%).
| Demographics | Rating | Rank | In Labor Force | Age 35-44 |
| Bolivians | 100.0 /100 | #6 | Exceptional 86.1% |
| Immigrants | Sierra Leone | 100.0 /100 | #7 | Exceptional 86.1% |
| Immigrants | Ethiopia | 100.0 /100 | #8 | Exceptional 85.9% |
| Ethiopians | 100.0 /100 | #9 | Exceptional 85.9% |
| Cape Verdeans | 100.0 /100 | #10 | Exceptional 85.8% |
| Immigrants | Cameroon | 100.0 /100 | #11 | Exceptional 85.8% |
| Liberians | 100.0 /100 | #12 | Exceptional 85.7% |
| Somalis | 100.0 /100 | #13 | Exceptional 85.6% |
| Immigrants | Somalia | 100.0 /100 | #14 | Exceptional 85.6% |
| Norwegians | 100.0 /100 | #15 | Exceptional 85.6% |
| Immigrants | Ireland | 100.0 /100 | #16 | Exceptional 85.6% |
| Immigrants | North Macedonia | 100.0 /100 | #17 | Exceptional 85.6% |
| Carpatho Rusyns | 100.0 /100 | #18 | Exceptional 85.6% |
| Slovenes | 100.0 /100 | #19 | Exceptional 85.6% |
| Immigrants | Serbia | 100.0 /100 | #20 | Exceptional 85.5% |
| Bulgarians | 100.0 /100 | #21 | Exceptional 85.5% |
| Immigrants | Bosnia and Herzegovina | 100.0 /100 | #22 | Exceptional 85.4% |
| Immigrants | Eastern Africa | 100.0 /100 | #23 | Exceptional 85.4% |
| Latvians | 99.9 /100 | #24 | Exceptional 85.4% |
| Paraguayans | 99.9 /100 | #25 | Exceptional 85.4% |
| Immigrants | Liberia | 99.9 /100 | #26 | Exceptional 85.4% |