Cheyenne vs Immigrants from Sierra Leone In Labor Force | Age 35-44

COMPARE

Cheyenne
Race
Ancestry
AfghanAfricanAlaska NativeAlaskan AthabascanAlbanianAleutAlsatianAmericanApacheArabArapahoArgentineanArmenianAssyrian/Chaldean/SyriacAustralianAustrianBahamianBangladeshiBarbadianBasqueBelgianBelizeanBermudanBhutaneseBlackfeetBolivianBrazilianBritishBritish West IndianBulgarianBurmeseCajunCambodianCanadianCape VerdeanCarpatho RusynCelticCentral AmericanCentral American IndianCherokeeCheyenneChickasawChileanChineseChippewaChoctawColombianColvilleComancheCosta RicanCreeCreekCroatianCrowCubanCypriotCzechCzechoslovakianDanishDelawareDominicanDutchDutch West IndianEastern EuropeanEcuadorianEgyptianEnglishEstonianEthiopianEuropeanFijianFilipinoFinnishFrenchFrench American IndianFrench CanadianGermanGerman RussianGhanaianGreekGuamanian/ChamorroGuatemalanGuyaneseHaitianHmongHonduranHopiHoumaHungarianIcelanderIndian (Asian)IndonesianInupiatIranianIraqiIrishIroquoisIsraeliItalianJamaicanJapaneseJordanianKenyanKiowaKoreanLaotianLatvianLebaneseLiberianLithuanianLumbeeLuxembourgerMacedonianMalaysianMalteseMarshalleseMenomineeMexicanMexican American IndianMongolianMoroccanNative HawaiianNavajoNepaleseNew ZealanderNicaraguanNigerianNorthern EuropeanNorwegianOkinawanOsageOttawaPaiutePakistaniPalestinianPanamanianParaguayanPennsylvania GermanPeruvianPimaPolishPortuguesePotawatomiPuebloPuerto RicanPuget Sound SalishRomanianRussianSalvadoranSamoanScandinavianScotch-IrishScottishSeminoleSenegaleseSerbianShoshoneSierra LeoneanSiouxSlavicSlovakSloveneSomaliSouth AfricanSouth AmericanSouth American IndianSoviet UnionSpaniardSpanishSpanish AmericanSpanish American IndianSri LankanSubsaharan AfricanSudaneseSwedishSwissSyrianTaiwaneseThaiTlingit-HaidaTohono O'OdhamTonganTrinidadian and TobagonianTsimshianTurkishU.S. Virgin IslanderUgandanUkrainianUruguayanUteVenezuelanVietnameseWelshWest IndianYakamaYaquiYugoslavianYumanYup'ikZimbabwean
Immigration
NonimmigrantsImmigrantsAfghanistanAfricaAlbaniaArgentinaArmeniaAsiaAustraliaAustriaBahamasBangladeshBarbadosBelarusBelgiumBelizeBoliviaBosnia and HerzegovinaBrazilBulgariaBurma/MyanmarCabo VerdeCambodiaCameroonCanadaCaribbeanCentral AmericaChileChinaColombiaCongoCosta RicaCroatiaCubaCzechoslovakiaDenmarkDominicaDominican RepublicEastern AfricaEastern AsiaEastern EuropeEcuadorEgyptEl SalvadorEnglandEritreaEthiopiaEuropeFijiFranceGermanyGhanaGreeceGrenadaGuatemalaGuyanaHaitiHondurasHong KongHungaryIndiaIndonesiaIranIraqIrelandIsraelItalyJamaicaJapanJordanKazakhstanKenyaKoreaKuwaitLaosLatin AmericaLatviaLebanonLiberiaLithuaniaMalaysiaMexicoMicronesiaMiddle AfricaMoldovaMoroccoNepalNetherlandsNicaraguaNigeriaNorth AmericaNorth MacedoniaNorthern AfricaNorthern EuropeNorwayOceaniaPakistanPanamaPeruPhilippinesPolandPortugalRomaniaRussiaSaudi ArabiaScotlandSenegalSerbiaSingaporeSomaliaSouth AfricaSouth AmericaSouth Central AsiaSouth Eastern AsiaSouthern EuropeSpainSri LankaSt. Vincent and the GrenadinesSudanSwedenSwitzerlandSyriaTaiwanThailandTrinidad and TobagoTurkeyUgandaUkraineUruguayUzbekistanVenezuelaVietnamWest IndiesWestern AfricaWestern AsiaWestern EuropeYemenZaireZimbabweAzores
Immigrants from Sierra Leone
Race
Ancestry
AfghanAfricanAlaska NativeAlaskan AthabascanAlbanianAleutAlsatianAmericanApacheArabArapahoArgentineanArmenianAssyrian/Chaldean/SyriacAustralianAustrianBahamianBangladeshiBarbadianBasqueBelgianBelizeanBermudanBhutaneseBlackfeetBolivianBrazilianBritishBritish West IndianBulgarianBurmeseCajunCambodianCanadianCape VerdeanCarpatho RusynCelticCentral AmericanCentral American IndianCherokeeChickasawChileanChineseChippewaChoctawColombianColvilleComancheCosta RicanCreeCreekCroatianCrowCubanCypriotCzechCzechoslovakianDanishDelawareDominicanDutchDutch West IndianEastern EuropeanEcuadorianEgyptianEnglishEstonianEthiopianEuropeanFijianFilipinoFinnishFrenchFrench American IndianFrench CanadianGermanGerman RussianGhanaianGreekGuamanian/ChamorroGuatemalanGuyaneseHaitianHmongHonduranHopiHoumaHungarianIcelanderIndian (Asian)IndonesianInupiatIranianIraqiIrishIroquoisIsraeliItalianJamaicanJapaneseJordanianKenyanKiowaKoreanLaotianLatvianLebaneseLiberianLithuanianLumbeeLuxembourgerMacedonianMalaysianMalteseMarshalleseMenomineeMexicanMexican American IndianMongolianMoroccanNative HawaiianNavajoNepaleseNew ZealanderNicaraguanNigerianNorthern EuropeanNorwegianOkinawanOsageOttawaPaiutePakistaniPalestinianPanamanianParaguayanPennsylvania GermanPeruvianPimaPolishPortuguesePotawatomiPuebloPuerto RicanPuget Sound SalishRomanianRussianSalvadoranSamoanScandinavianScotch-IrishScottishSeminoleSenegaleseSerbianShoshoneSierra LeoneanSiouxSlavicSlovakSloveneSomaliSouth AfricanSouth AmericanSouth American IndianSoviet UnionSpaniardSpanishSpanish AmericanSpanish American IndianSri LankanSubsaharan AfricanSudaneseSwedishSwissSyrianTaiwaneseThaiTlingit-HaidaTohono O'OdhamTonganTrinidadian and TobagonianTsimshianTurkishU.S. Virgin IslanderUgandanUkrainianUruguayanUteVenezuelanVietnameseWelshWest IndianYakamaYaquiYugoslavianYumanYup'ikZimbabwean
Immigration
NonimmigrantsImmigrantsAfghanistanAfricaAlbaniaArgentinaArmeniaAsiaAustraliaAustriaBahamasBangladeshBarbadosBelarusBelgiumBelizeBoliviaBosnia and HerzegovinaBrazilBulgariaBurma/MyanmarCabo VerdeCambodiaCameroonCanadaCaribbeanCentral AmericaChileChinaColombiaCongoCosta RicaCroatiaCubaCzechoslovakiaDenmarkDominicaDominican RepublicEastern AfricaEastern AsiaEastern EuropeEcuadorEgyptEl SalvadorEnglandEritreaEthiopiaEuropeFijiFranceGermanyGhanaGreeceGrenadaGuatemalaGuyanaHaitiHondurasHong KongHungaryIndiaIndonesiaIranIraqIrelandIsraelItalyJamaicaJapanJordanKazakhstanKenyaKoreaKuwaitLaosLatin AmericaLatviaLebanonLiberiaLithuaniaMalaysiaMexicoMicronesiaMiddle AfricaMoldovaMoroccoNepalNetherlandsNicaraguaNigeriaNorth AmericaNorth MacedoniaNorthern AfricaNorthern EuropeNorwayOceaniaPakistanPanamaPeruPhilippinesPolandPortugalRomaniaRussiaSaudi ArabiaScotlandSenegalSerbiaSierra LeoneSingaporeSomaliaSouth AfricaSouth AmericaSouth Central AsiaSouth Eastern AsiaSouthern EuropeSpainSri LankaSt. Vincent and the GrenadinesSudanSwedenSwitzerlandSyriaTaiwanThailandTrinidad and TobagoTurkeyUgandaUkraineUruguayUzbekistanVenezuelaVietnamWest IndiesWestern AfricaWestern AsiaWestern EuropeYemenZaireZimbabweAzores
In Labor Force | Age 35-44
Income
Poverty
Unemployment
Labor Participation
Family Structure
Vehicle Availability
Education Level
Disability

In Labor Force | Age 35-44 Comparison

Cheyenne

Immigrants from Sierra Leone

Tragic
Exceptional
79.5%
IN LABOR FORCE | AGE 35-44
0.0/ 100
METRIC RATING
330th/ 347
METRIC RANK
86.1%
IN LABOR FORCE | AGE 35-44
100.0/ 100
METRIC RATING
7th/ 347
METRIC RANK

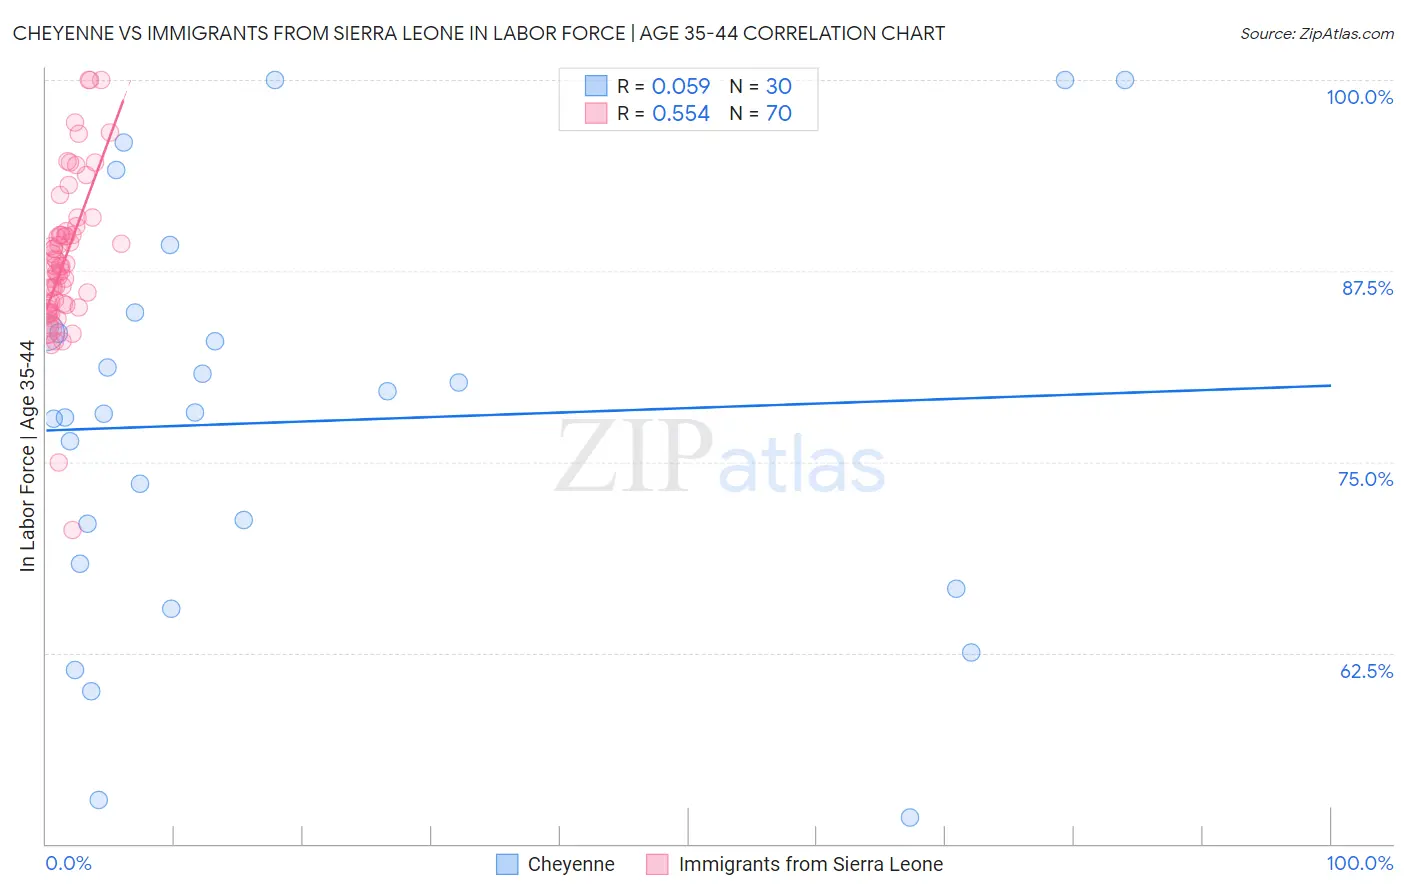
Cheyenne vs Immigrants from Sierra Leone In Labor Force | Age 35-44 Correlation Chart

The statistical analysis conducted on geographies consisting of 80,703,463 people shows a slight positive correlation between the proportion of Cheyenne and labor force participation rate among population between the ages 35 and 44 in the United States with a correlation coefficient (R) of 0.059 and weighted average of 79.5%. Similarly, the statistical analysis conducted on geographies consisting of 101,643,562 people shows a substantial positive correlation between the proportion of Immigrants from Sierra Leone and labor force participation rate among population between the ages 35 and 44 in the United States with a correlation coefficient (R) of 0.554 and weighted average of 86.1%, a difference of 8.2%.
Cheyenne vs Immigrants from Sierra Leone In Labor Force | Age 35-44

In Labor Force | Age 35-44 Correlation Summary

MeasurementCheyenneImmigrants from Sierra Leone
Minimum51.7%70.5%
Maximum100.0%100.0%
Range48.3%29.5%
Mean77.6%88.2%
Median78.2%87.8%
Interquartile 25% (IQ1)68.3%85.3%
Interquartile 75% (IQ3)83.4%89.9%
Interquartile Range (IQR)15.1%4.6%
Standard Deviation (Sample)13.1%5.0%
Standard Deviation (Population)12.9%5.0%

Similar Demographics by In Labor Force | Age 35-44

Demographics Similar to Cheyenne by In Labor Force | Age 35-44

In terms of in labor force | age 35-44, the demographic groups most similar to Cheyenne are Houma (79.5%, a difference of 0.020%), Ute (79.4%, a difference of 0.080%), Menominee (79.7%, a difference of 0.20%), Kiowa (79.2%, a difference of 0.41%), and Creek (80.0%, a difference of 0.64%).
DemographicsRating | RankIn Labor Force | Age 35-44
Yaqui
0.0
/100
|
#323
Tragic
80.5%
Choctaw
0.0
/100
|
#324
Tragic
80.5%
Dutch West Indians
0.0
/100
|
#325
Tragic
80.4%
Seminole
0.0
/100
|
#326
Tragic
80.4%
Sioux
0.0
/100
|
#327
Tragic
80.2%
Creek
0.0
/100
|
#328
Tragic
80.0%
Menominee
0.0
/100
|
#329
Tragic
79.7%
Cheyenne
0.0
/100
|
#330
Tragic
79.5%
Houma
0.0
/100
|
#331
Tragic
79.5%
Ute
0.0
/100
|
#332
Tragic
79.4%
Kiowa
0.0
/100
|
#333
Tragic
79.2%
Yakama
0.0
/100
|
#334
Tragic
79.0%
Natives/Alaskans
0.0
/100
|
#335
Tragic
78.9%
Arapaho
0.0
/100
|
#336
Tragic
78.1%
Apache
0.0
/100
|
#337
Tragic
77.9%

Demographics Similar to Immigrants from Sierra Leone by In Labor Force | Age 35-44

In terms of in labor force | age 35-44, the demographic groups most similar to Immigrants from Sierra Leone are Bolivian (86.1%, a difference of 0.040%), Zimbabwean (86.1%, a difference of 0.050%), Immigrants from Ethiopia (85.9%, a difference of 0.17%), Immigrants from Cabo Verde (86.2%, a difference of 0.18%), and Ethiopian (85.9%, a difference of 0.18%).
DemographicsRating | RankIn Labor Force | Age 35-44
Sierra Leoneans
100.0
/100
|
#1
Exceptional
86.4%
Luxembourgers
100.0
/100
|
#2
Exceptional
86.4%
Immigrants | Bolivia
100.0
/100
|
#3
Exceptional
86.2%
Immigrants | Cabo Verde
100.0
/100
|
#4
Exceptional
86.2%
Zimbabweans
100.0
/100
|
#5
Exceptional
86.1%
Bolivians
100.0
/100
|
#6
Exceptional
86.1%
Immigrants | Sierra Leone
100.0
/100
|
#7
Exceptional
86.1%
Immigrants | Ethiopia
100.0
/100
|
#8
Exceptional
85.9%
Ethiopians
100.0
/100
|
#9
Exceptional
85.9%
Cape Verdeans
100.0
/100
|
#10
Exceptional
85.8%
Immigrants | Cameroon
100.0
/100
|
#11
Exceptional
85.8%
Liberians
100.0
/100
|
#12
Exceptional
85.7%
Somalis
100.0
/100
|
#13
Exceptional
85.6%
Immigrants | Somalia
100.0
/100
|
#14
Exceptional
85.6%
Norwegians
100.0
/100
|
#15
Exceptional
85.6%