Immigrants from Lebanon vs Immigrants from Australia In Labor Force | Age 45-54

COMPARE

Immigrants from Lebanon
Race
Ancestry
AfghanAfricanAlaska NativeAlaskan AthabascanAlbanianAleutAlsatianAmericanApacheArabArapahoArgentineanArmenianAssyrian/Chaldean/SyriacAustralianAustrianBahamianBangladeshiBarbadianBasqueBelgianBelizeanBermudanBhutaneseBlackfeetBolivianBrazilianBritishBritish West IndianBulgarianBurmeseCajunCambodianCanadianCape VerdeanCarpatho RusynCelticCentral AmericanCentral American IndianCherokeeCheyenneChickasawChileanChineseChippewaChoctawColombianColvilleComancheCosta RicanCreeCreekCroatianCrowCubanCypriotCzechCzechoslovakianDanishDelawareDominicanDutchDutch West IndianEastern EuropeanEcuadorianEgyptianEnglishEstonianEthiopianEuropeanFijianFilipinoFinnishFrenchFrench American IndianFrench CanadianGermanGerman RussianGhanaianGreekGuamanian/ChamorroGuatemalanGuyaneseHaitianHmongHonduranHopiHoumaHungarianIcelanderIndian (Asian)IndonesianInupiatIranianIraqiIrishIroquoisIsraeliItalianJamaicanJapaneseJordanianKenyanKiowaKoreanLaotianLatvianLebaneseLiberianLithuanianLumbeeLuxembourgerMacedonianMalaysianMalteseMarshalleseMenomineeMexicanMexican American IndianMongolianMoroccanNative HawaiianNavajoNepaleseNew ZealanderNicaraguanNigerianNorthern EuropeanNorwegianOkinawanOsageOttawaPaiutePakistaniPalestinianPanamanianParaguayanPennsylvania GermanPeruvianPimaPolishPortuguesePotawatomiPuebloPuerto RicanPuget Sound SalishRomanianRussianSalvadoranSamoanScandinavianScotch-IrishScottishSeminoleSenegaleseSerbianShoshoneSierra LeoneanSiouxSlavicSlovakSloveneSomaliSouth AfricanSouth AmericanSouth American IndianSoviet UnionSpaniardSpanishSpanish AmericanSpanish American IndianSri LankanSubsaharan AfricanSudaneseSwedishSwissSyrianTaiwaneseThaiTlingit-HaidaTohono O'OdhamTonganTrinidadian and TobagonianTsimshianTurkishU.S. Virgin IslanderUgandanUkrainianUruguayanUteVenezuelanVietnameseWelshWest IndianYakamaYaquiYugoslavianYumanYup'ikZimbabwean
Immigration
NonimmigrantsImmigrantsAfghanistanAfricaAlbaniaArgentinaArmeniaAsiaAustriaBahamasBangladeshBarbadosBelarusBelgiumBelizeBoliviaBosnia and HerzegovinaBrazilBulgariaBurma/MyanmarCabo VerdeCambodiaCameroonCanadaCaribbeanCentral AmericaChileChinaColombiaCongoCosta RicaCroatiaCubaCzechoslovakiaDenmarkDominicaDominican RepublicEastern AfricaEastern AsiaEastern EuropeEcuadorEgyptEl SalvadorEnglandEritreaEthiopiaEuropeFijiFranceGermanyGhanaGreeceGrenadaGuatemalaGuyanaHaitiHondurasHong KongHungaryIndiaIndonesiaIranIraqIrelandIsraelItalyJamaicaJapanJordanKazakhstanKenyaKoreaKuwaitLaosLatin AmericaLatviaLebanonLiberiaLithuaniaMalaysiaMexicoMicronesiaMiddle AfricaMoldovaMoroccoNepalNetherlandsNicaraguaNigeriaNorth AmericaNorth MacedoniaNorthern AfricaNorthern EuropeNorwayOceaniaPakistanPanamaPeruPhilippinesPolandPortugalRomaniaRussiaSaudi ArabiaScotlandSenegalSerbiaSierra LeoneSingaporeSomaliaSouth AfricaSouth AmericaSouth Central AsiaSouth Eastern AsiaSouthern EuropeSpainSri LankaSt. Vincent and the GrenadinesSudanSwedenSwitzerlandSyriaTaiwanThailandTrinidad and TobagoTurkeyUgandaUkraineUruguayUzbekistanVenezuelaVietnamWest IndiesWestern AfricaWestern AsiaWestern EuropeYemenZaireZimbabweAzores
Immigrants from Australia
Race
Ancestry
AfghanAfricanAlaska NativeAlaskan AthabascanAlbanianAleutAlsatianAmericanApacheArabArapahoArgentineanArmenianAssyrian/Chaldean/SyriacAustralianAustrianBahamianBangladeshiBarbadianBasqueBelgianBelizeanBermudanBhutaneseBlackfeetBolivianBrazilianBritishBritish West IndianBulgarianBurmeseCajunCambodianCanadianCape VerdeanCarpatho RusynCelticCentral AmericanCentral American IndianCherokeeCheyenneChickasawChileanChineseChippewaChoctawColombianColvilleComancheCosta RicanCreeCreekCroatianCrowCubanCypriotCzechCzechoslovakianDanishDelawareDominicanDutchDutch West IndianEastern EuropeanEcuadorianEgyptianEnglishEstonianEthiopianEuropeanFijianFilipinoFinnishFrenchFrench American IndianFrench CanadianGermanGerman RussianGhanaianGreekGuamanian/ChamorroGuatemalanGuyaneseHaitianHmongHonduranHopiHoumaHungarianIcelanderIndian (Asian)IndonesianInupiatIranianIraqiIrishIroquoisIsraeliItalianJamaicanJapaneseJordanianKenyanKiowaKoreanLaotianLatvianLebaneseLiberianLithuanianLumbeeLuxembourgerMacedonianMalaysianMalteseMarshalleseMenomineeMexicanMexican American IndianMongolianMoroccanNative HawaiianNavajoNepaleseNew ZealanderNicaraguanNigerianNorthern EuropeanNorwegianOkinawanOsageOttawaPaiutePakistaniPalestinianPanamanianParaguayanPennsylvania GermanPeruvianPimaPolishPortuguesePotawatomiPuebloPuerto RicanPuget Sound SalishRomanianRussianSalvadoranSamoanScandinavianScotch-IrishScottishSeminoleSenegaleseSerbianShoshoneSierra LeoneanSiouxSlavicSlovakSloveneSomaliSouth AfricanSouth AmericanSouth American IndianSoviet UnionSpaniardSpanishSpanish AmericanSpanish American IndianSri LankanSubsaharan AfricanSudaneseSwedishSwissSyrianTaiwaneseThaiTlingit-HaidaTohono O'OdhamTonganTrinidadian and TobagonianTsimshianTurkishU.S. Virgin IslanderUgandanUkrainianUruguayanUteVenezuelanVietnameseWelshWest IndianYakamaYaquiYugoslavianYumanYup'ikZimbabwean
Immigration
NonimmigrantsImmigrantsAfghanistanAfricaAlbaniaArgentinaArmeniaAsiaAustraliaAustriaBahamasBangladeshBarbadosBelarusBelgiumBelizeBoliviaBosnia and HerzegovinaBrazilBulgariaBurma/MyanmarCabo VerdeCambodiaCameroonCanadaCaribbeanCentral AmericaChileChinaColombiaCongoCosta RicaCroatiaCubaCzechoslovakiaDenmarkDominicaDominican RepublicEastern AfricaEastern AsiaEastern EuropeEcuadorEgyptEl SalvadorEnglandEritreaEthiopiaEuropeFijiFranceGermanyGhanaGreeceGrenadaGuatemalaGuyanaHaitiHondurasHong KongHungaryIndiaIndonesiaIranIraqIrelandIsraelItalyJamaicaJapanJordanKazakhstanKenyaKoreaKuwaitLaosLatin AmericaLatviaLiberiaLithuaniaMalaysiaMexicoMicronesiaMiddle AfricaMoldovaMoroccoNepalNetherlandsNicaraguaNigeriaNorth AmericaNorth MacedoniaNorthern AfricaNorthern EuropeNorwayOceaniaPakistanPanamaPeruPhilippinesPolandPortugalRomaniaRussiaSaudi ArabiaScotlandSenegalSerbiaSierra LeoneSingaporeSomaliaSouth AfricaSouth AmericaSouth Central AsiaSouth Eastern AsiaSouthern EuropeSpainSri LankaSt. Vincent and the GrenadinesSudanSwedenSwitzerlandSyriaTaiwanThailandTrinidad and TobagoTurkeyUgandaUkraineUruguayUzbekistanVenezuelaVietnamWest IndiesWestern AfricaWestern AsiaWestern EuropeYemenZaireZimbabweAzores
In Labor Force | Age 45-54
Income
Poverty
Unemployment
Labor Participation
Family Structure
Vehicle Availability
Education Level
Disability

In Labor Force | Age 45-54 Comparison

Immigrants from Lebanon

Immigrants from Australia

Tragic
Good
82.3%
IN LABOR FORCE | AGE 45-54
7.4/ 100
METRIC RATING
209th/ 347
METRIC RANK
82.9%
IN LABOR FORCE | AGE 45-54
68.2/ 100
METRIC RATING
157th/ 347
METRIC RANK

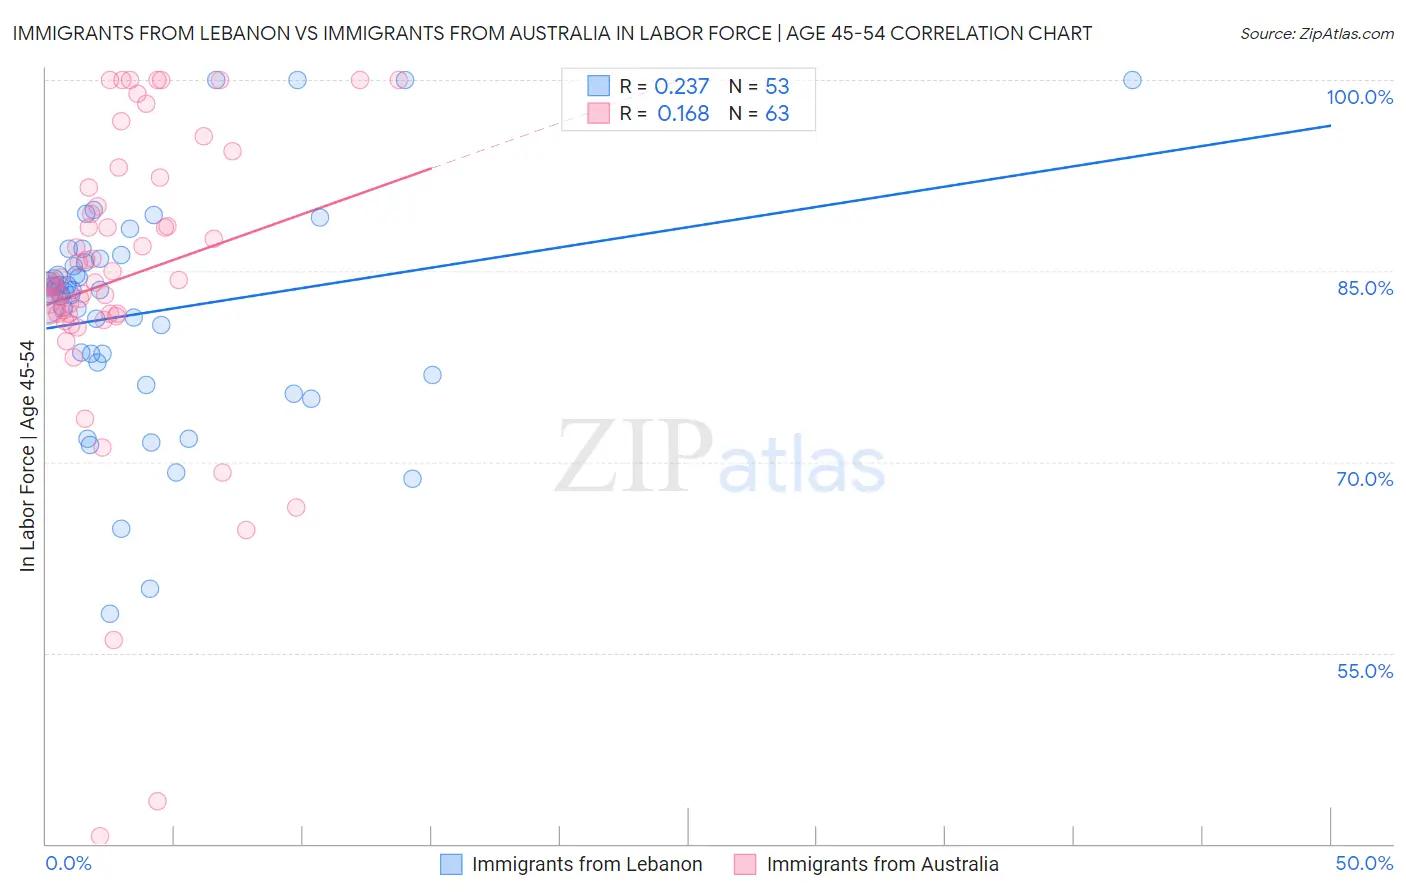
Immigrants from Lebanon vs Immigrants from Australia In Labor Force | Age 45-54 Correlation Chart

The statistical analysis conducted on geographies consisting of 217,118,694 people shows a weak positive correlation between the proportion of Immigrants from Lebanon and labor force participation rate among population between the ages 45 and 54 in the United States with a correlation coefficient (R) of 0.237 and weighted average of 82.3%. Similarly, the statistical analysis conducted on geographies consisting of 227,126,379 people shows a poor positive correlation between the proportion of Immigrants from Australia and labor force participation rate among population between the ages 45 and 54 in the United States with a correlation coefficient (R) of 0.168 and weighted average of 82.9%, a difference of 0.73%.
Immigrants from Lebanon vs Immigrants from Australia In Labor Force | Age 45-54

In Labor Force | Age 45-54 Correlation Summary

MeasurementImmigrants from LebanonImmigrants from Australia
Minimum58.1%40.6%
Maximum100.0%100.0%
Range41.9%59.4%
Mean81.8%84.5%
Median83.4%84.2%
Interquartile 25% (IQ1)77.3%81.6%
Interquartile 75% (IQ3)85.8%91.5%
Interquartile Range (IQR)8.5%9.9%
Standard Deviation (Sample)8.8%12.0%
Standard Deviation (Population)8.7%11.9%

Similar Demographics by In Labor Force | Age 45-54

Demographics Similar to Immigrants from Lebanon by In Labor Force | Age 45-54

In terms of in labor force | age 45-54, the demographic groups most similar to Immigrants from Lebanon are Immigrants from Bahamas (82.3%, a difference of 0.010%), Native Hawaiian (82.3%, a difference of 0.030%), Immigrants from Syria (82.3%, a difference of 0.030%), Immigrants from Cabo Verde (82.3%, a difference of 0.040%), and Ecuadorian (82.3%, a difference of 0.040%).
DemographicsRating | RankIn Labor Force | Age 45-54
Immigrants | Western Asia
14.9
/100
|
#202
Poor
82.4%
Arabs
11.6
/100
|
#203
Poor
82.4%
Immigrants | Western Europe
10.9
/100
|
#204
Poor
82.4%
Senegalese
9.5
/100
|
#205
Tragic
82.4%
Welsh
9.2
/100
|
#206
Tragic
82.3%
Immigrants | Cabo Verde
8.6
/100
|
#207
Tragic
82.3%
Native Hawaiians
8.5
/100
|
#208
Tragic
82.3%
Immigrants | Lebanon
7.4
/100
|
#209
Tragic
82.3%
Immigrants | Bahamas
7.1
/100
|
#210
Tragic
82.3%
Immigrants | Syria
6.6
/100
|
#211
Tragic
82.3%
Ecuadorians
6.3
/100
|
#212
Tragic
82.3%
Immigrants | Uzbekistan
5.8
/100
|
#213
Tragic
82.3%
Immigrants | Panama
5.6
/100
|
#214
Tragic
82.2%
Iraqis
5.6
/100
|
#215
Tragic
82.2%
Scottish
5.3
/100
|
#216
Tragic
82.2%

Demographics Similar to Immigrants from Australia by In Labor Force | Age 45-54

In terms of in labor force | age 45-54, the demographic groups most similar to Immigrants from Australia are Immigrants from Southern Europe (82.9%, a difference of 0.0%), Immigrants from Philippines (82.9%, a difference of 0.010%), Immigrants from Saudi Arabia (82.9%, a difference of 0.010%), Immigrants from Indonesia (82.9%, a difference of 0.020%), and Immigrants from Ghana (82.9%, a difference of 0.020%).
DemographicsRating | RankIn Labor Force | Age 45-54
Immigrants | Netherlands
72.6
/100
|
#150
Good
82.9%
Koreans
71.9
/100
|
#151
Good
82.9%
Slavs
71.5
/100
|
#152
Good
82.9%
Immigrants | Indonesia
70.6
/100
|
#153
Good
82.9%
Immigrants | Ghana
70.3
/100
|
#154
Good
82.9%
Immigrants | Philippines
69.0
/100
|
#155
Good
82.9%
Immigrants | Saudi Arabia
68.8
/100
|
#156
Good
82.9%
Immigrants | Australia
68.2
/100
|
#157
Good
82.9%
Immigrants | Southern Europe
67.8
/100
|
#158
Good
82.9%
Immigrants | Austria
64.6
/100
|
#159
Good
82.9%
Laotians
62.8
/100
|
#160
Good
82.9%
South American Indians
62.2
/100
|
#161
Good
82.9%
Haitians
61.8
/100
|
#162
Good
82.8%
Dutch
61.7
/100
|
#163
Good
82.8%
German Russians
61.3
/100
|
#164
Good
82.8%